Fig. 3.
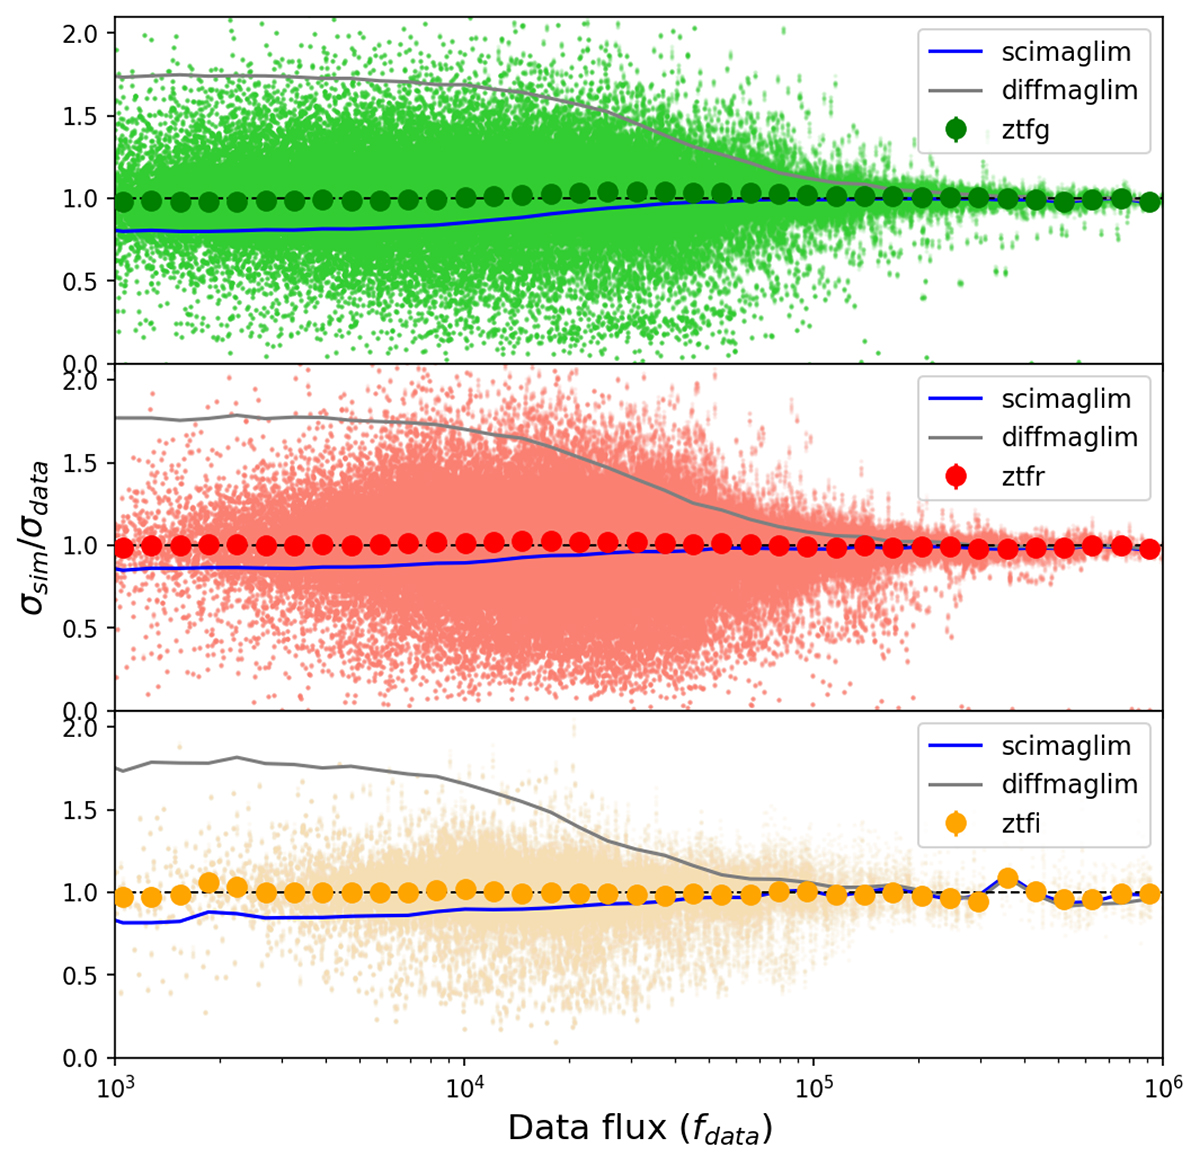
Download original image
Ratio of the simulated and DR2 flux uncertainties (σsim/σdata) as a function of data flux in the g (top), r (middle), and i (bottom) bands. The small points show the comparison between every simulated and observed object at every phase, and the larger points show the associated median binned values, both after correction for sky noise (see text for details). The blue curves (scimaglim) show the binned values obtained from the science image, and the grey curves (diffmaglim) show the binned values obtained from the difference-image limiting magnitudes, both without correction for sky noise.
Current usage metrics show cumulative count of Article Views (full-text article views including HTML views, PDF and ePub downloads, according to the available data) and Abstracts Views on Vision4Press platform.
Data correspond to usage on the plateform after 2015. The current usage metrics is available 48-96 hours after online publication and is updated daily on week days.
Initial download of the metrics may take a while.