Open Access
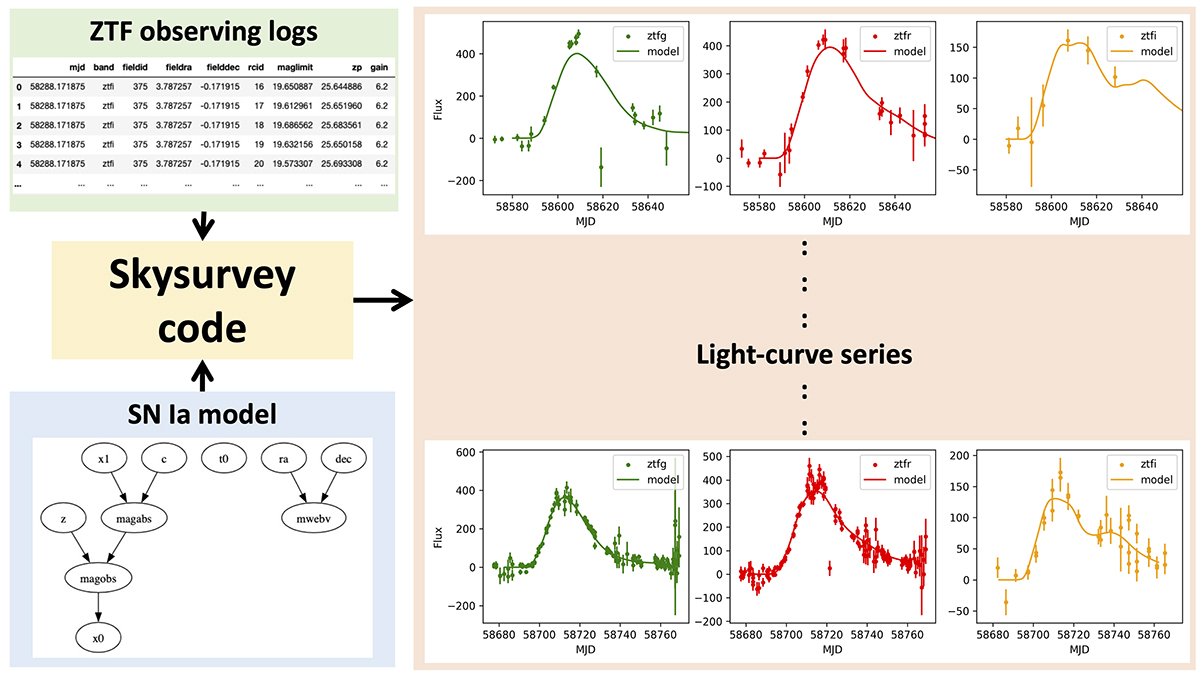
Fig. 1.
Download original image
Schematic representation of our simulation pipeline. Left: Model light curves are generated and combined with the true ZTF observing conditions to produce the simulated light curves. Right: comparison between our predicted dataset and the ZTF SN Ia DR2.
Current usage metrics show cumulative count of Article Views (full-text article views including HTML views, PDF and ePub downloads, according to the available data) and Abstracts Views on Vision4Press platform.
Data correspond to usage on the plateform after 2015. The current usage metrics is available 48-96 hours after online publication and is updated daily on week days.
Initial download of the metrics may take a while.