Fig. 9
Download original image
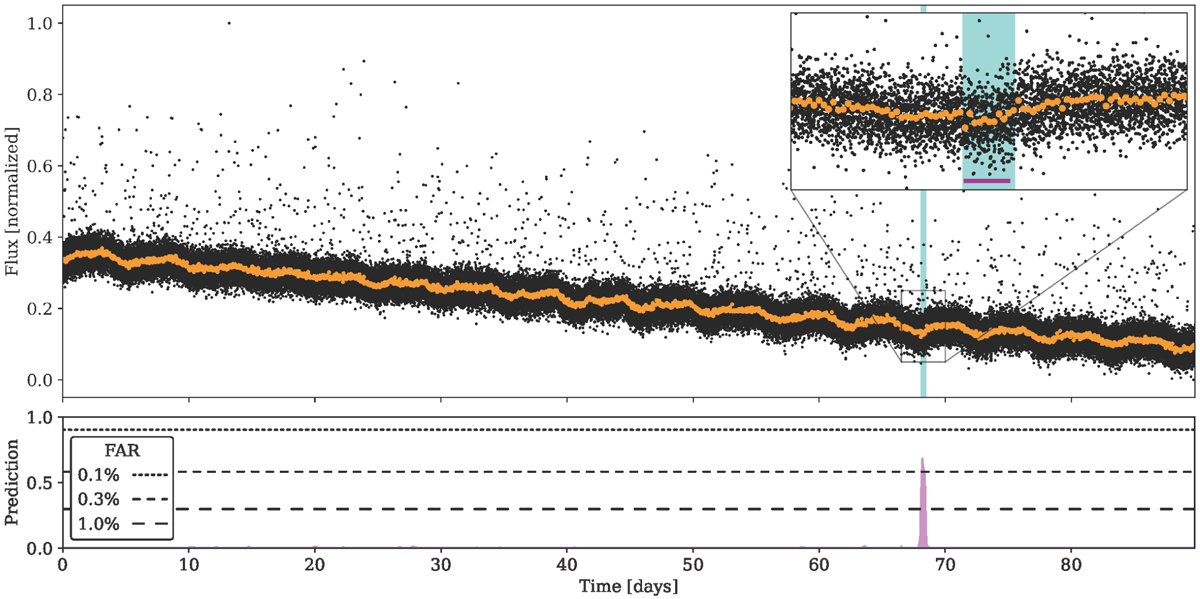
Example detection of an Earth-analog with a depth of 83.16 ppm (S/N of 0.88) using model C. The top panel shows the light curve in black dots, and its one-hour bin is in orange, with the ground truth of the transit shown as a blue span. The bottom panel shows the associated prediction map of the model in purple, with the associated FARs of the model shown as dashed lines. The zoomed-in section highlights the transit, and the model’s predicted position of the transit is indicated with a purple line, extracted at the 1% FAR.
Current usage metrics show cumulative count of Article Views (full-text article views including HTML views, PDF and ePub downloads, according to the available data) and Abstracts Views on Vision4Press platform.
Data correspond to usage on the plateform after 2015. The current usage metrics is available 48-96 hours after online publication and is updated daily on week days.
Initial download of the metrics may take a while.