Open Access
Fig. 8
Download original image
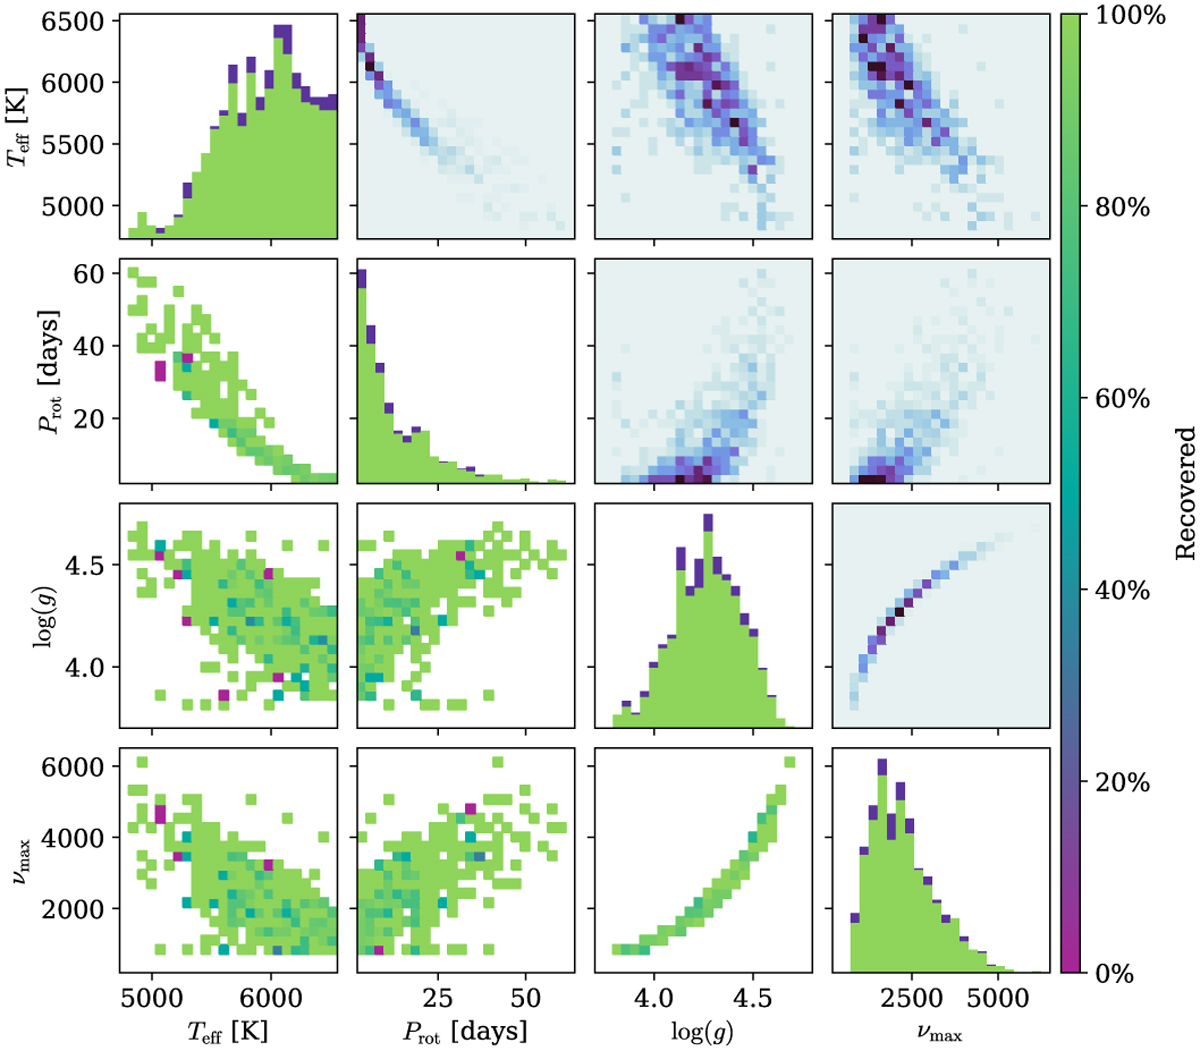
Recovery rate depending on the stellar activity using model A. Each panel of this corner plot illustrates the recovered fraction of planets, for any two stellar activity parameters, while the diagonal shows the recovery for the corresponding parameter. The upper-right corner shows the distribution of the complete dataset.
Current usage metrics show cumulative count of Article Views (full-text article views including HTML views, PDF and ePub downloads, according to the available data) and Abstracts Views on Vision4Press platform.
Data correspond to usage on the plateform after 2015. The current usage metrics is available 48-96 hours after online publication and is updated daily on week days.
Initial download of the metrics may take a while.