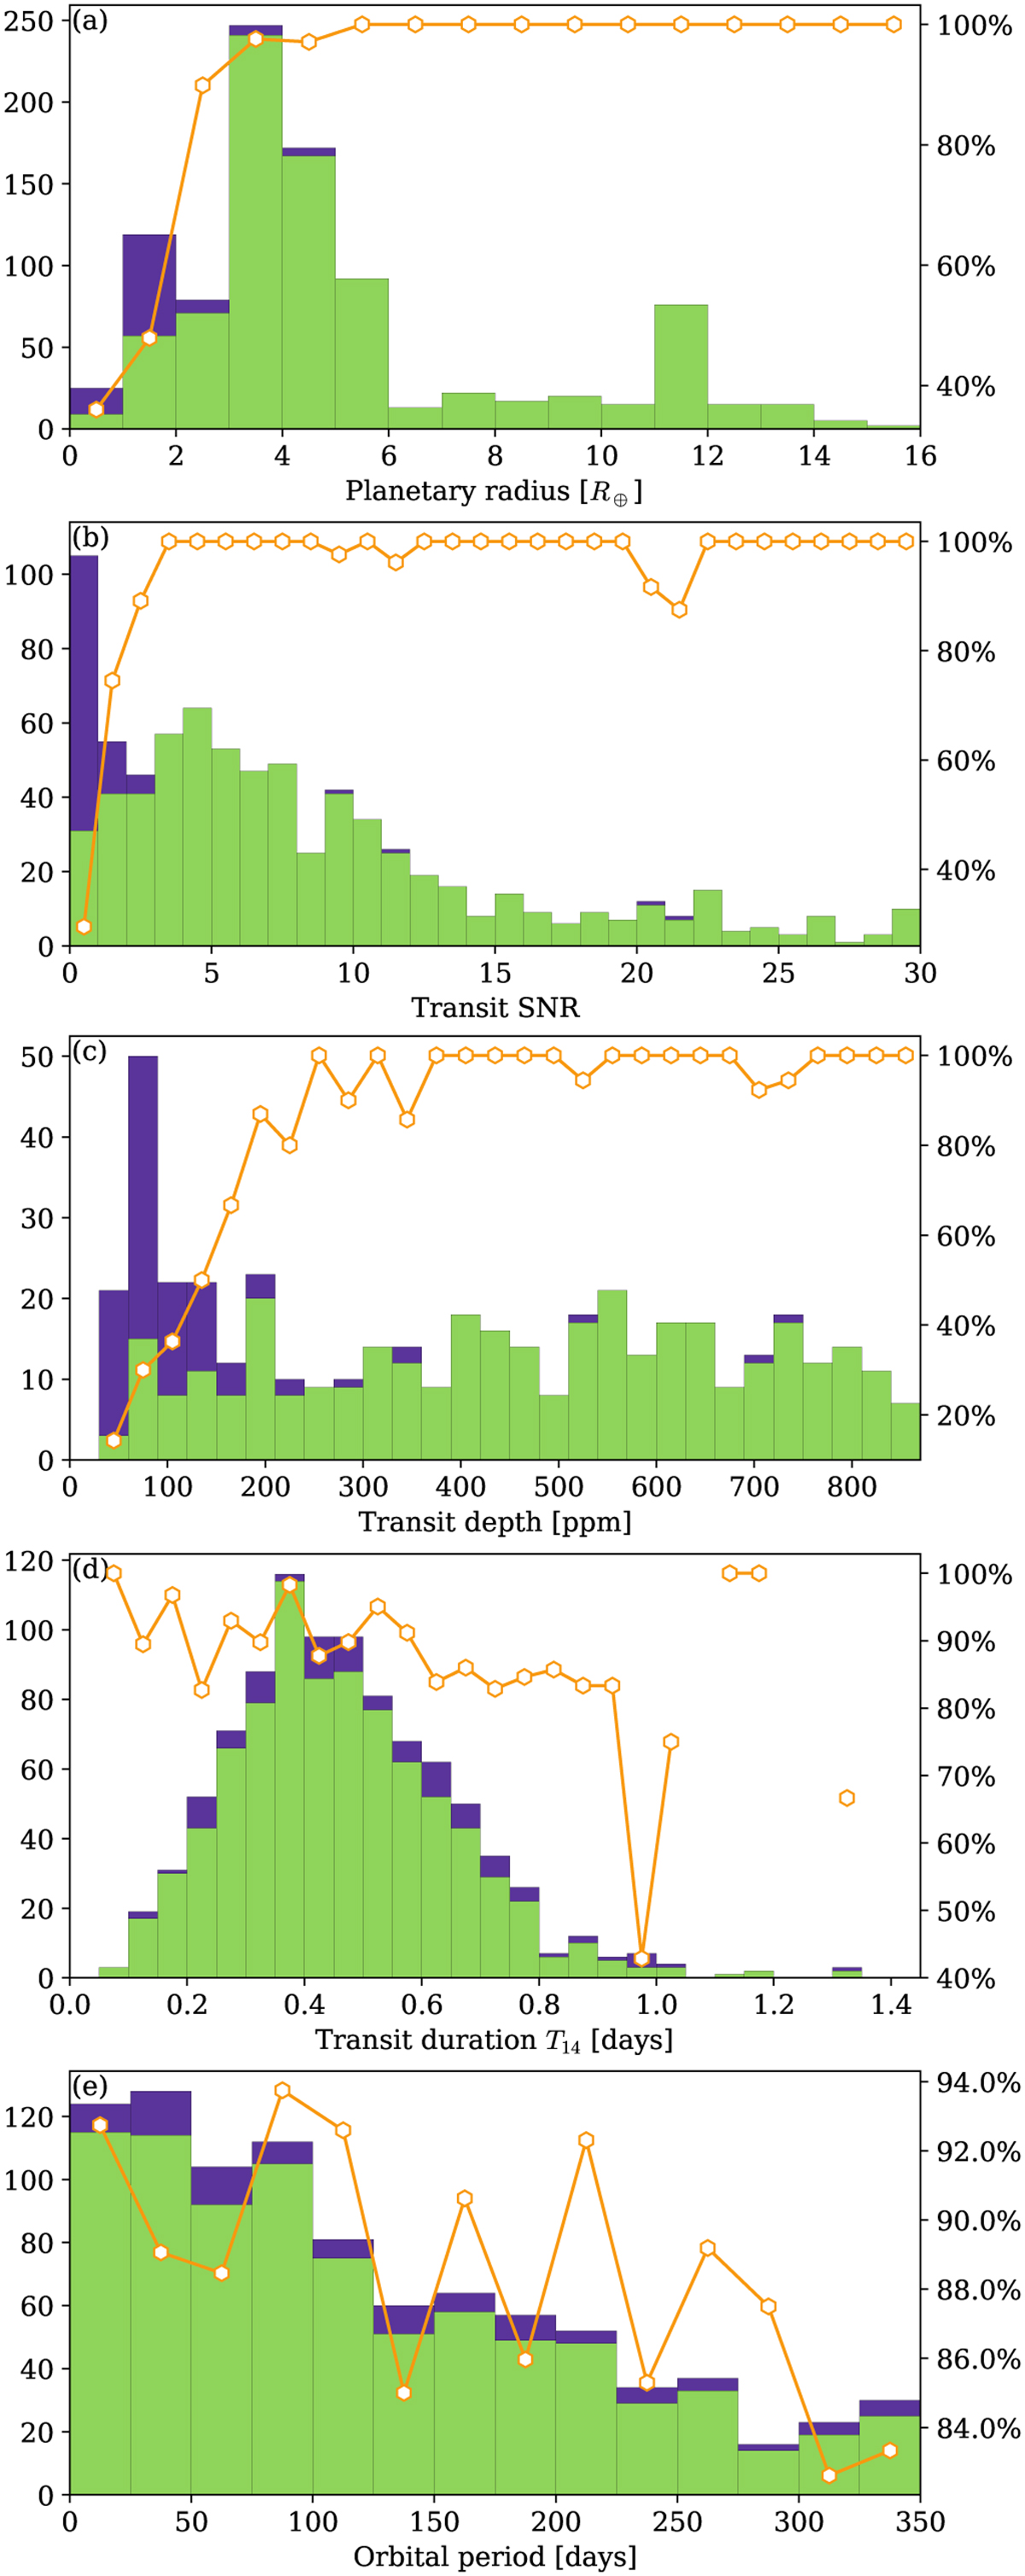
Fig. 5
Download original image
Recovery capabilities of model C. Each panel shows a physical characteristic of our test population, in purple, as well as the fraction recovered by the model, in green. Overlaid in orange is the fraction of the recovered transits per bin. Panel b illustrates that the main cause of missed transits is low S/N. Additionally, panel e shows that the ability to detect transits is not linked to the orbital period, and single transits are therefore detected.
Current usage metrics show cumulative count of Article Views (full-text article views including HTML views, PDF and ePub downloads, according to the available data) and Abstracts Views on Vision4Press platform.
Data correspond to usage on the plateform after 2015. The current usage metrics is available 48-96 hours after online publication and is updated daily on week days.
Initial download of the metrics may take a while.