Open Access
Fig. 4
Download original image
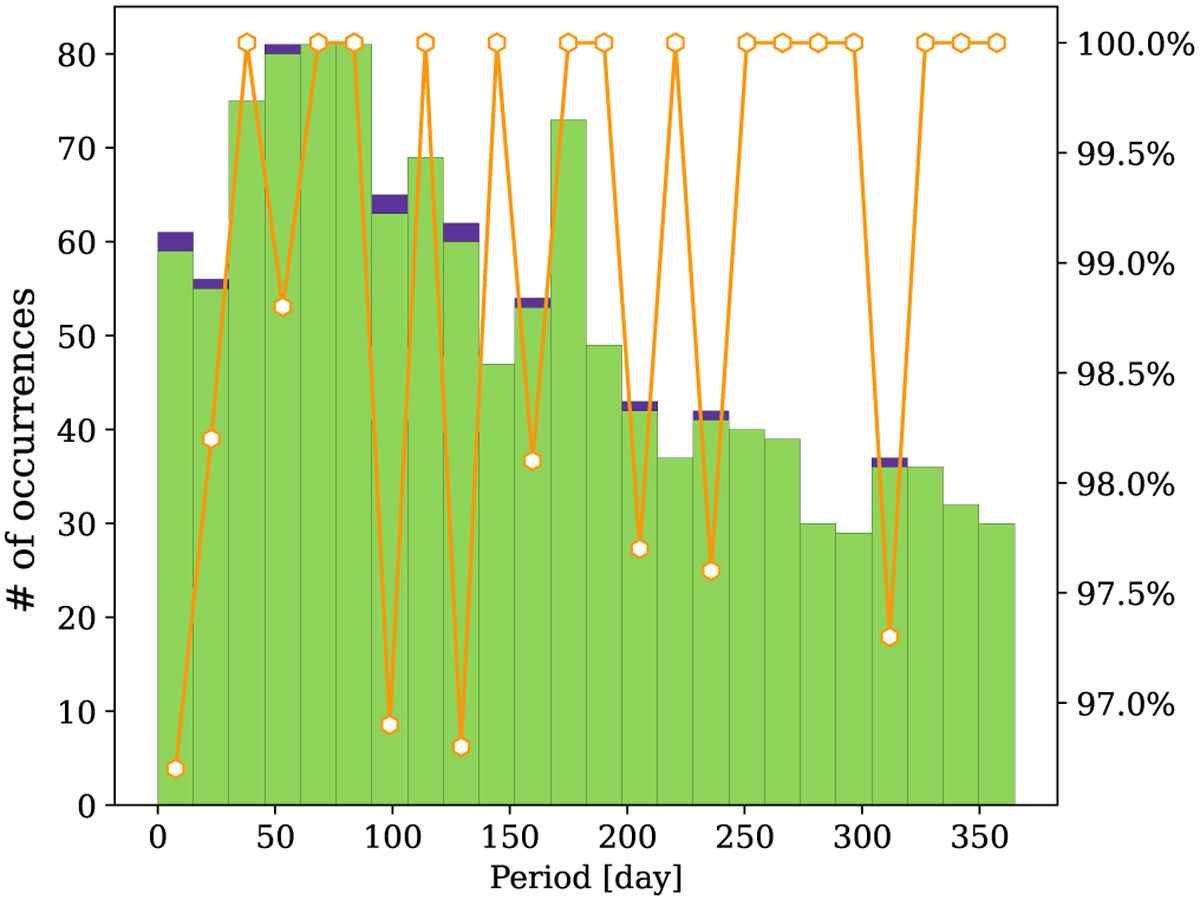
Eclipsing binary transit recovery capabilities. We show the number of recovered transits compared to the total number of binary transits in the dataset, with the corresponding fraction overplotted in orange. The values were found with model B, but all of our models show quasiidentical results for binaries.
Current usage metrics show cumulative count of Article Views (full-text article views including HTML views, PDF and ePub downloads, according to the available data) and Abstracts Views on Vision4Press platform.
Data correspond to usage on the plateform after 2015. The current usage metrics is available 48-96 hours after online publication and is updated daily on week days.
Initial download of the metrics may take a while.