Fig. 3
Download original image
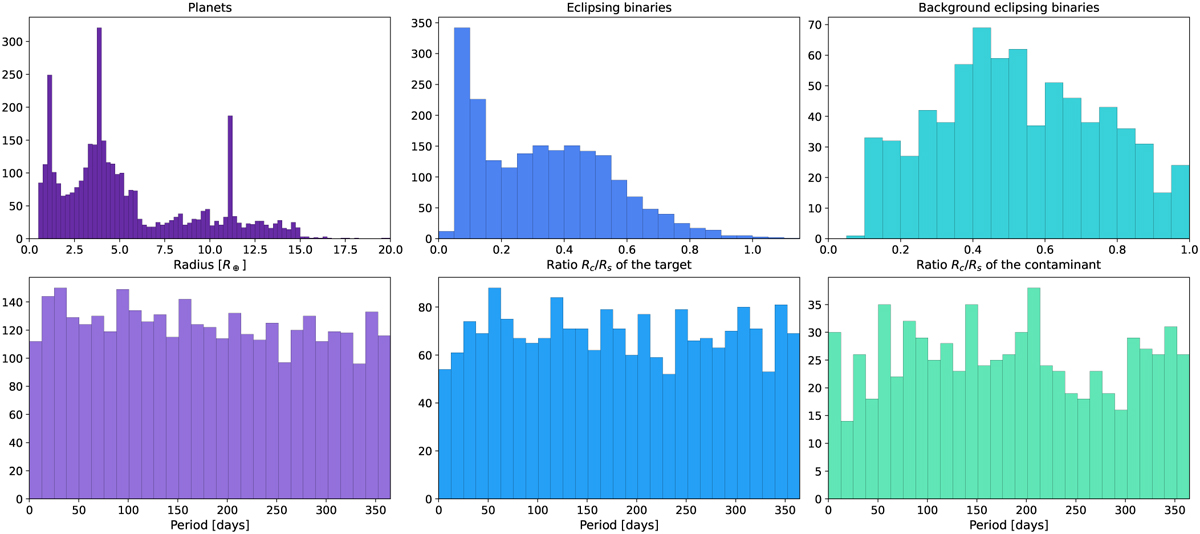
Histograms of the radii and periods of the bodies in our dataset. The left, center, and right columns respectively correspond to the planets, the eclipsing binaries, and the background eclipsing binaries. The three spikes in the planetary population correspond to an erroneous simulation run that did not include the sampling of radii around the central values of the distribution.
Current usage metrics show cumulative count of Article Views (full-text article views including HTML views, PDF and ePub downloads, according to the available data) and Abstracts Views on Vision4Press platform.
Data correspond to usage on the plateform after 2015. The current usage metrics is available 48-96 hours after online publication and is updated daily on week days.
Initial download of the metrics may take a while.