Fig. 10
Download original image
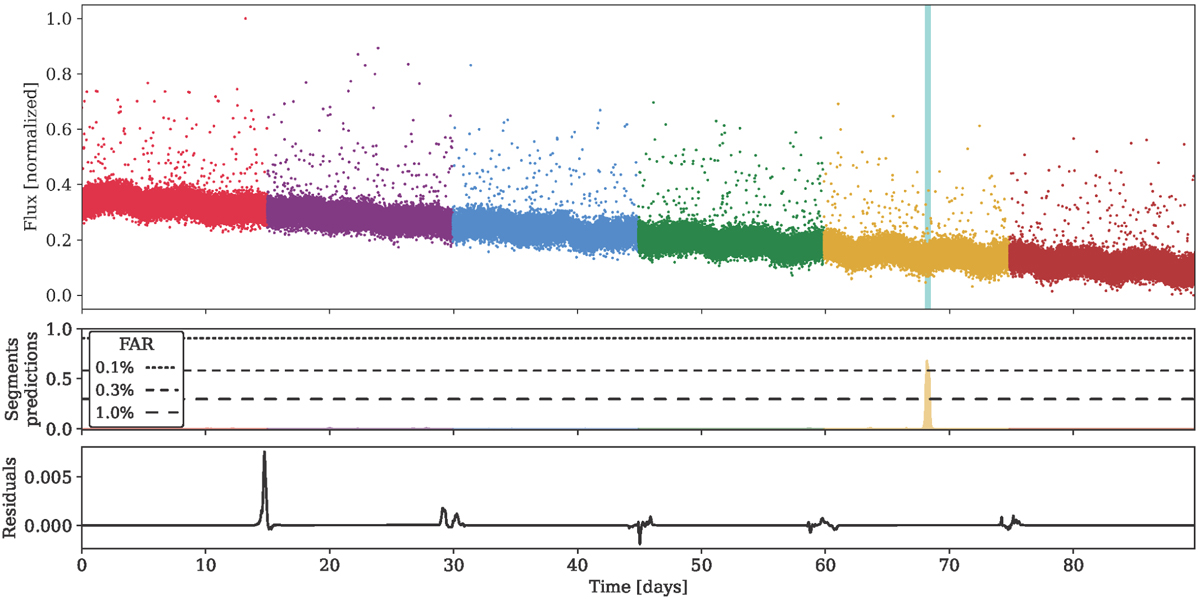
Same example as in Fig. 9, but the light curve is segmented into six individual portions. The sections can be identified by their color. We ran the model on each individual segment and show the resulting predictions with their respective color code. The residuals illustrate the difference between the segmented predictions and the whole light curve prediction.
Current usage metrics show cumulative count of Article Views (full-text article views including HTML views, PDF and ePub downloads, according to the available data) and Abstracts Views on Vision4Press platform.
Data correspond to usage on the plateform after 2015. The current usage metrics is available 48-96 hours after online publication and is updated daily on week days.
Initial download of the metrics may take a while.