Fig. 4
Download original image
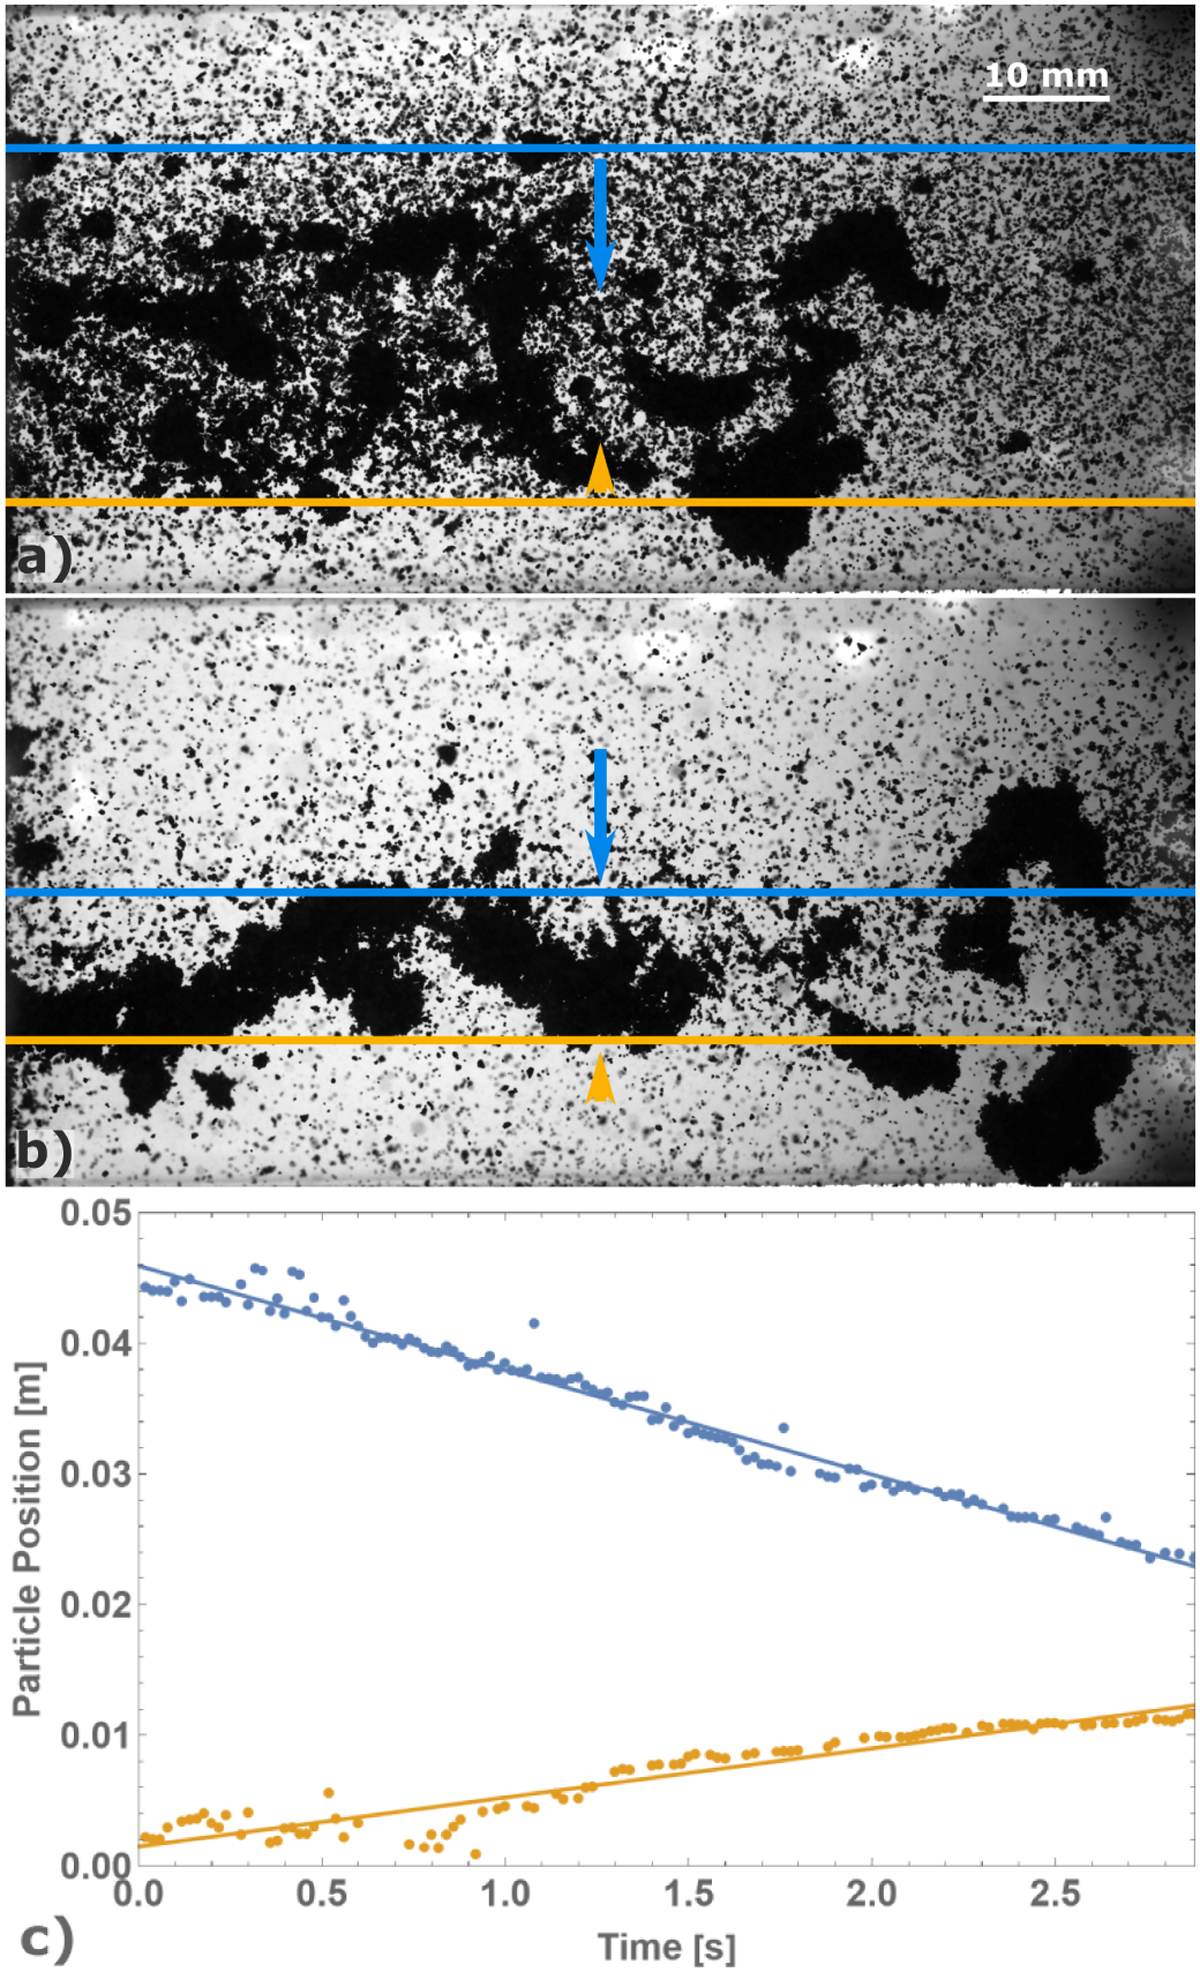
Particle movement in microgravity. Panels a and b: sequence of two images at different points in time with horizontal lines visualizing the systematic motion of the particles. Panel c: a horizontal, average brightness threshold can be used to track the particle motion. The slopes of the particle positions give the typical collision velocities.
Current usage metrics show cumulative count of Article Views (full-text article views including HTML views, PDF and ePub downloads, according to the available data) and Abstracts Views on Vision4Press platform.
Data correspond to usage on the plateform after 2015. The current usage metrics is available 48-96 hours after online publication and is updated daily on week days.
Initial download of the metrics may take a while.