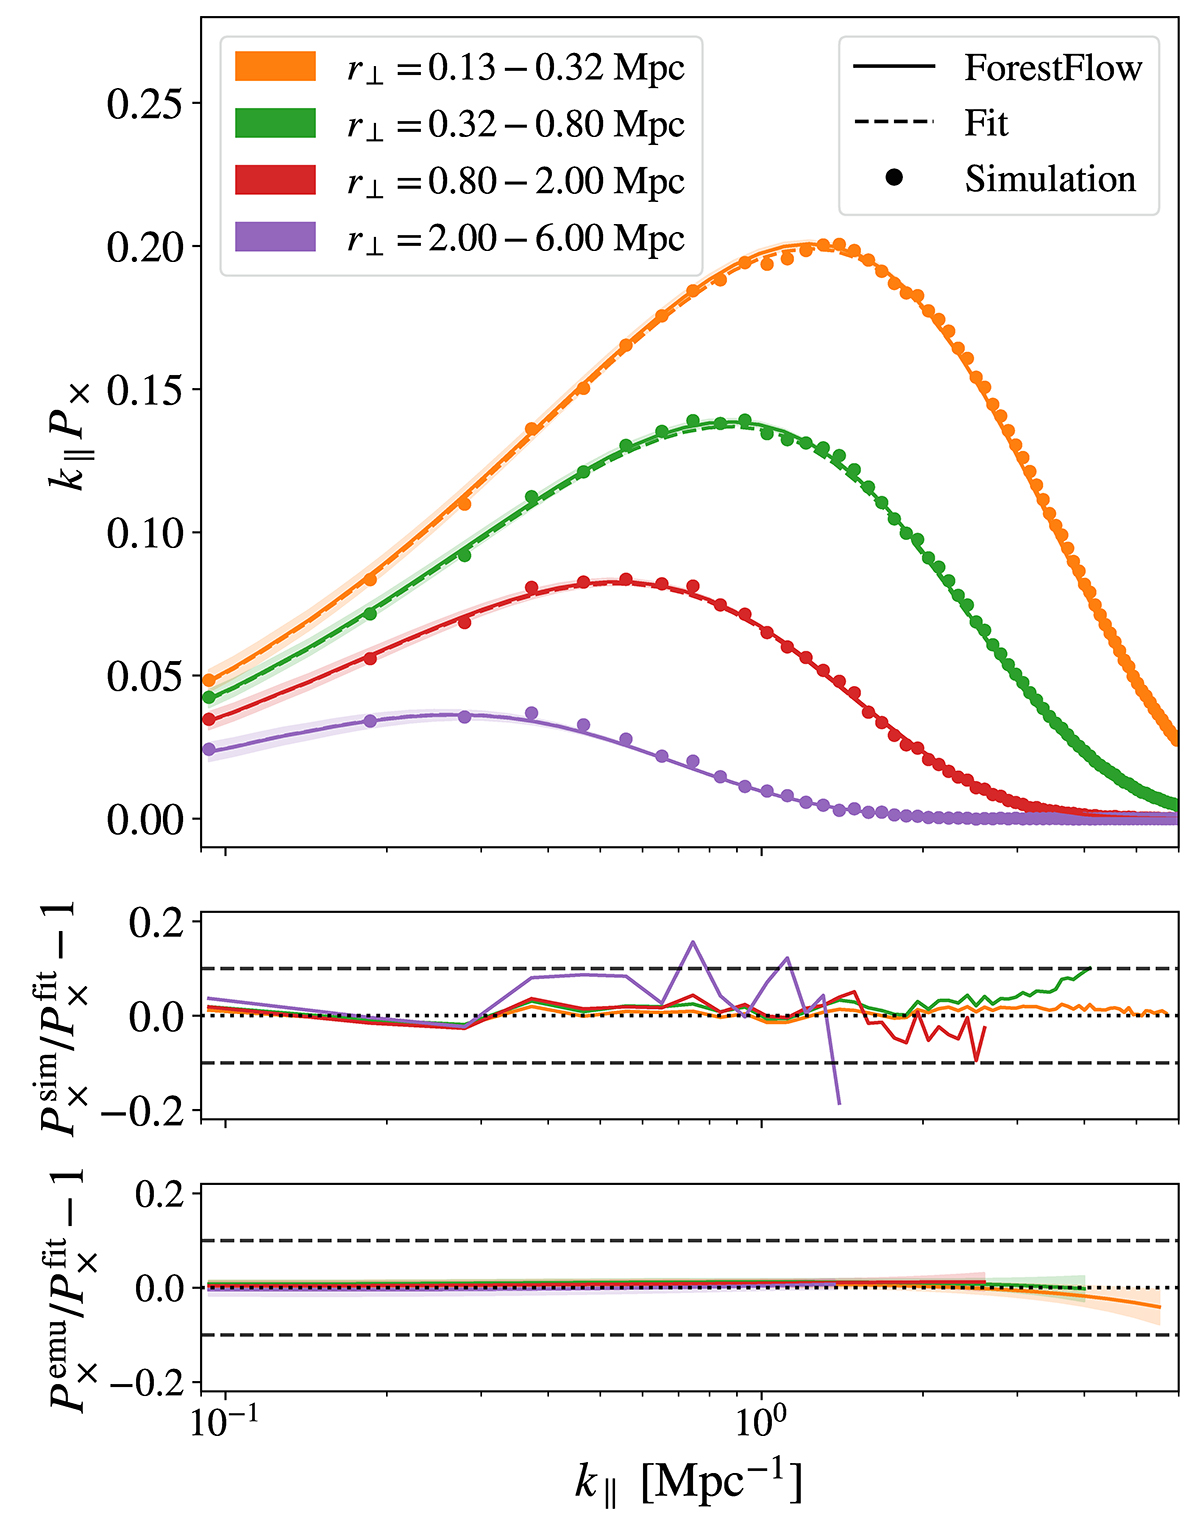
Fig. 9.
Download original image
Accuracy of the parametric model and FORESTFLOW in describing P× measurements from the CENTRAL simulation at z = 3. Dots show simulation measurements, dashed lines depict predictions from the best-fitting parametric model to P3D and P1D measurements, and solid lines and shaded areas display the average and 68% credible interval of FORESTFLOW predictions. The color of the lines indicates the results for different bins in transverse separation r⊥. The middle panel shows the residual between simulation measurements and the best-fitting parametric model, while the bottom panel displays the residual between predictions from the parametric model and FORESTFLOW. The performance of FORESTFLOW in reproducing simulation measurements is similar to that of the best-fitting model.
Current usage metrics show cumulative count of Article Views (full-text article views including HTML views, PDF and ePub downloads, according to the available data) and Abstracts Views on Vision4Press platform.
Data correspond to usage on the plateform after 2015. The current usage metrics is available 48-96 hours after online publication and is updated daily on week days.
Initial download of the metrics may take a while.