Fig. 8.
Download original image
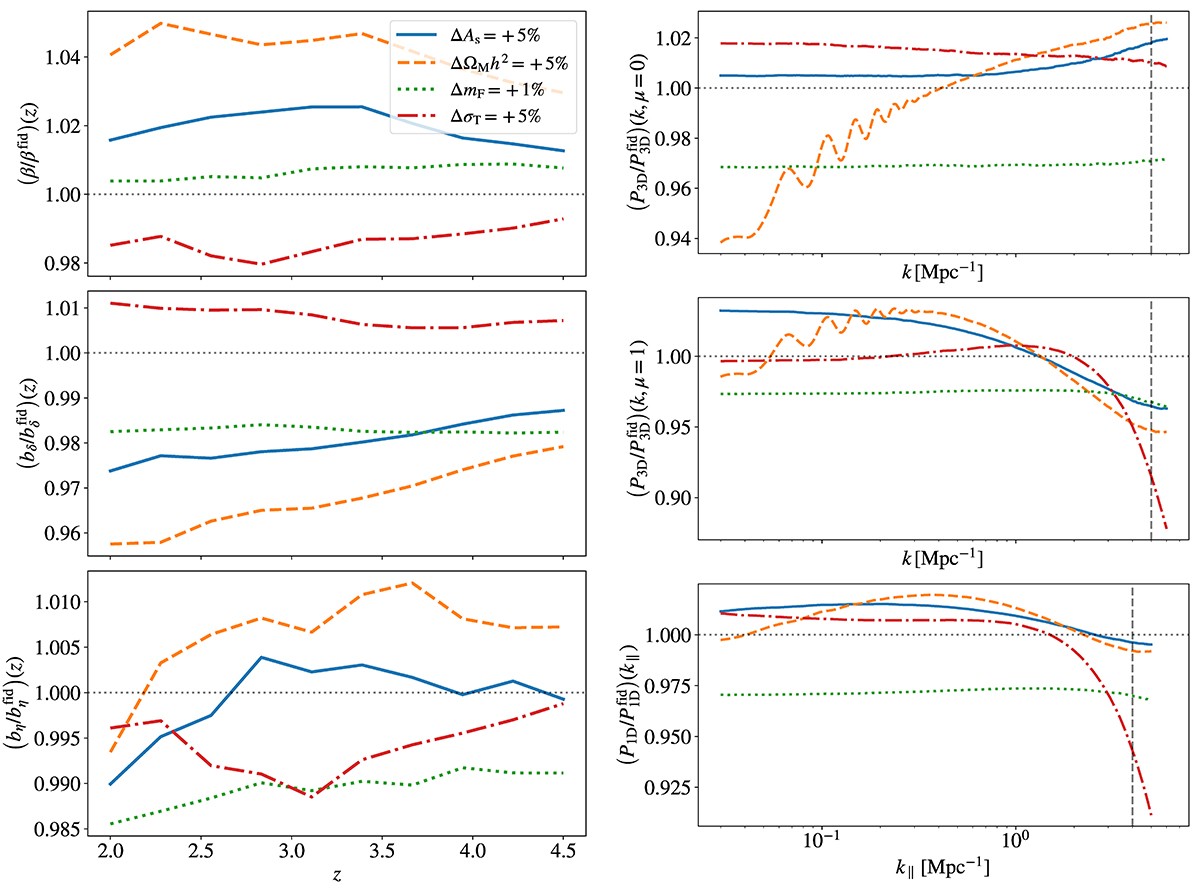
Response of Lyman-α clustering to variations in cosmology and IGM physics according to FORESTFLOW. The top, middle, and bottom panels of the left column show the results for β, bδ, and bη, respectively, while those of the right column do so for the perpendicular modes of P3D, the parallel modes of P3D, and P1D. Blue, orange, and red lines show the response of the previous quantities to a 5% increase in As, ΩMh2, and σT, respectively, while green lines do so for a 1% increase in ![]() .
.
Current usage metrics show cumulative count of Article Views (full-text article views including HTML views, PDF and ePub downloads, according to the available data) and Abstracts Views on Vision4Press platform.
Data correspond to usage on the plateform after 2015. The current usage metrics is available 48-96 hours after online publication and is updated daily on week days.
Initial download of the metrics may take a while.