Open Access
Fig. 4.
Download original image
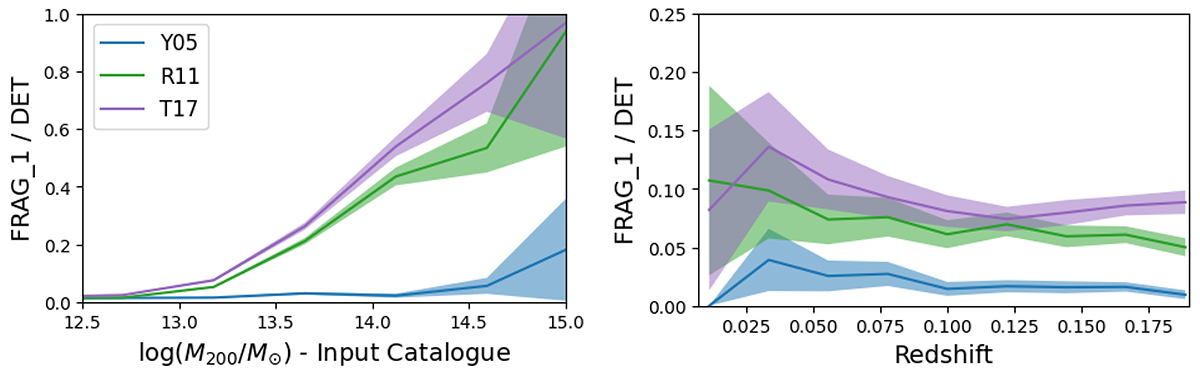
Statistical distribution of fragmentation as function of halo mass (left) and redshift (right panel). The shaded bands mark the 95th binomial confidence interval. This represents the fraction of systems that have one or more fragments in the FOF catalogue. The colours follow the same legend used in Fig. 3.
Current usage metrics show cumulative count of Article Views (full-text article views including HTML views, PDF and ePub downloads, according to the available data) and Abstracts Views on Vision4Press platform.
Data correspond to usage on the plateform after 2015. The current usage metrics is available 48-96 hours after online publication and is updated daily on week days.
Initial download of the metrics may take a while.