Fig. 5
Download original image
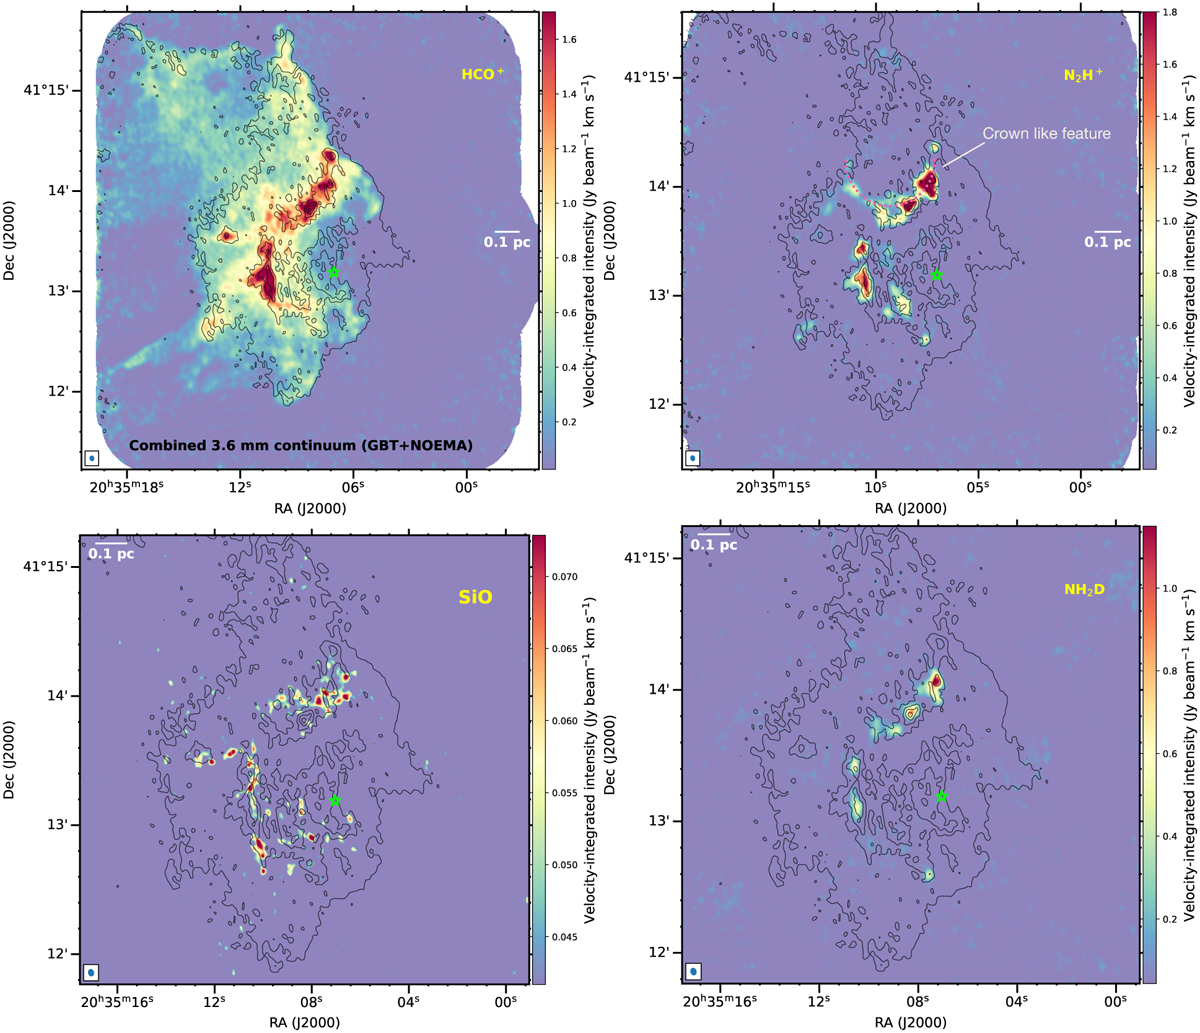
Velocity-integrated intensity maps of HCO+ (6km s−1 to 15.6km s−1), N2H+ (−1.2km s−1 to 17.2km s−1 spanning all the hfs transitions) in the upper row and SiO (8km s−1 to 10km s−1) and NH2D (0km s−1 to 15.2km s−1 covering all the hfs transitions) in the lower row. The black contours represent the GBT+NOEMA combined 3.6 mm continuum emission, and the bright green marker indicates the position of the ionizing source, DR18-05. The contour levels of the mm continuum are the same as shown in Fig. 3. The horizontal white scale bar has a size of 0.1 pc at a given distance of 1.4 kpc. The beam of the maps of each species is displayed on the left corner of each image panel.
Current usage metrics show cumulative count of Article Views (full-text article views including HTML views, PDF and ePub downloads, according to the available data) and Abstracts Views on Vision4Press platform.
Data correspond to usage on the plateform after 2015. The current usage metrics is available 48-96 hours after online publication and is updated daily on week days.
Initial download of the metrics may take a while.