Fig. 4
Download original image
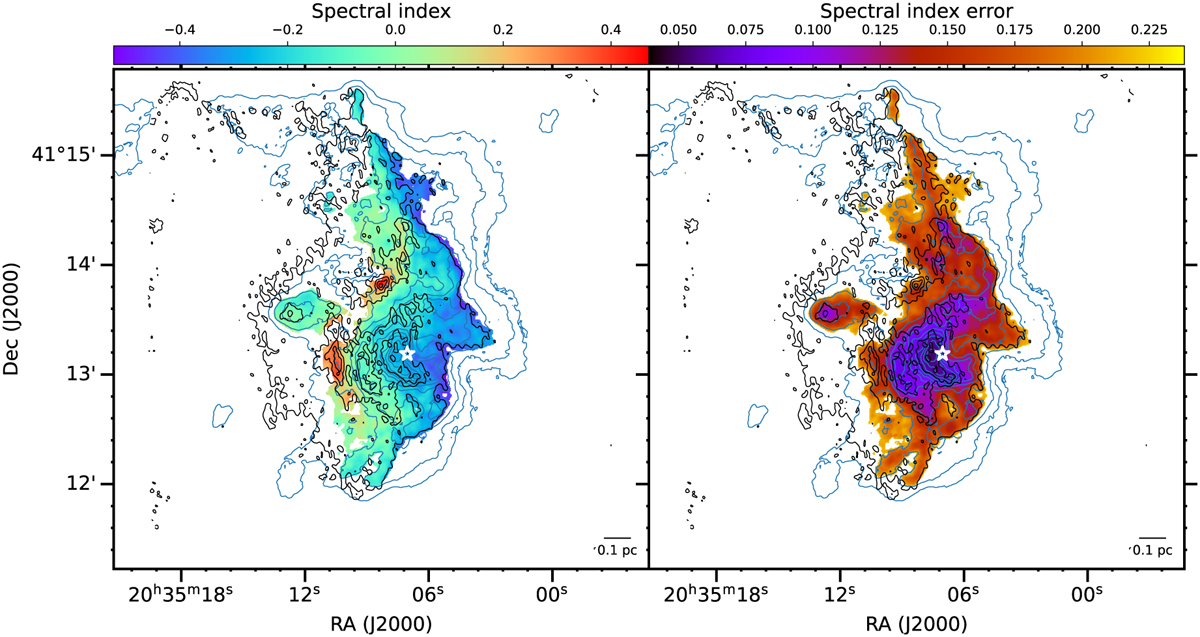
90 GHz – 5.8 GHz spectral index map in the left panel and its spectral index error map in the right panel. The higher frequency data are smoothed to the beam size of the lower frequency data to achieve a common resolution of 4″. The star symbol indicates the position of the B2 star. The black contours are the 3.6 mm continuum flux, and their levels are the same as in the left panel of Fig. 3, and the blue contours are the 6 cm continuum emission with the same contour levels shown in the right panel.
Current usage metrics show cumulative count of Article Views (full-text article views including HTML views, PDF and ePub downloads, according to the available data) and Abstracts Views on Vision4Press platform.
Data correspond to usage on the plateform after 2015. The current usage metrics is available 48-96 hours after online publication and is updated daily on week days.
Initial download of the metrics may take a while.