Fig. 14
Download original image
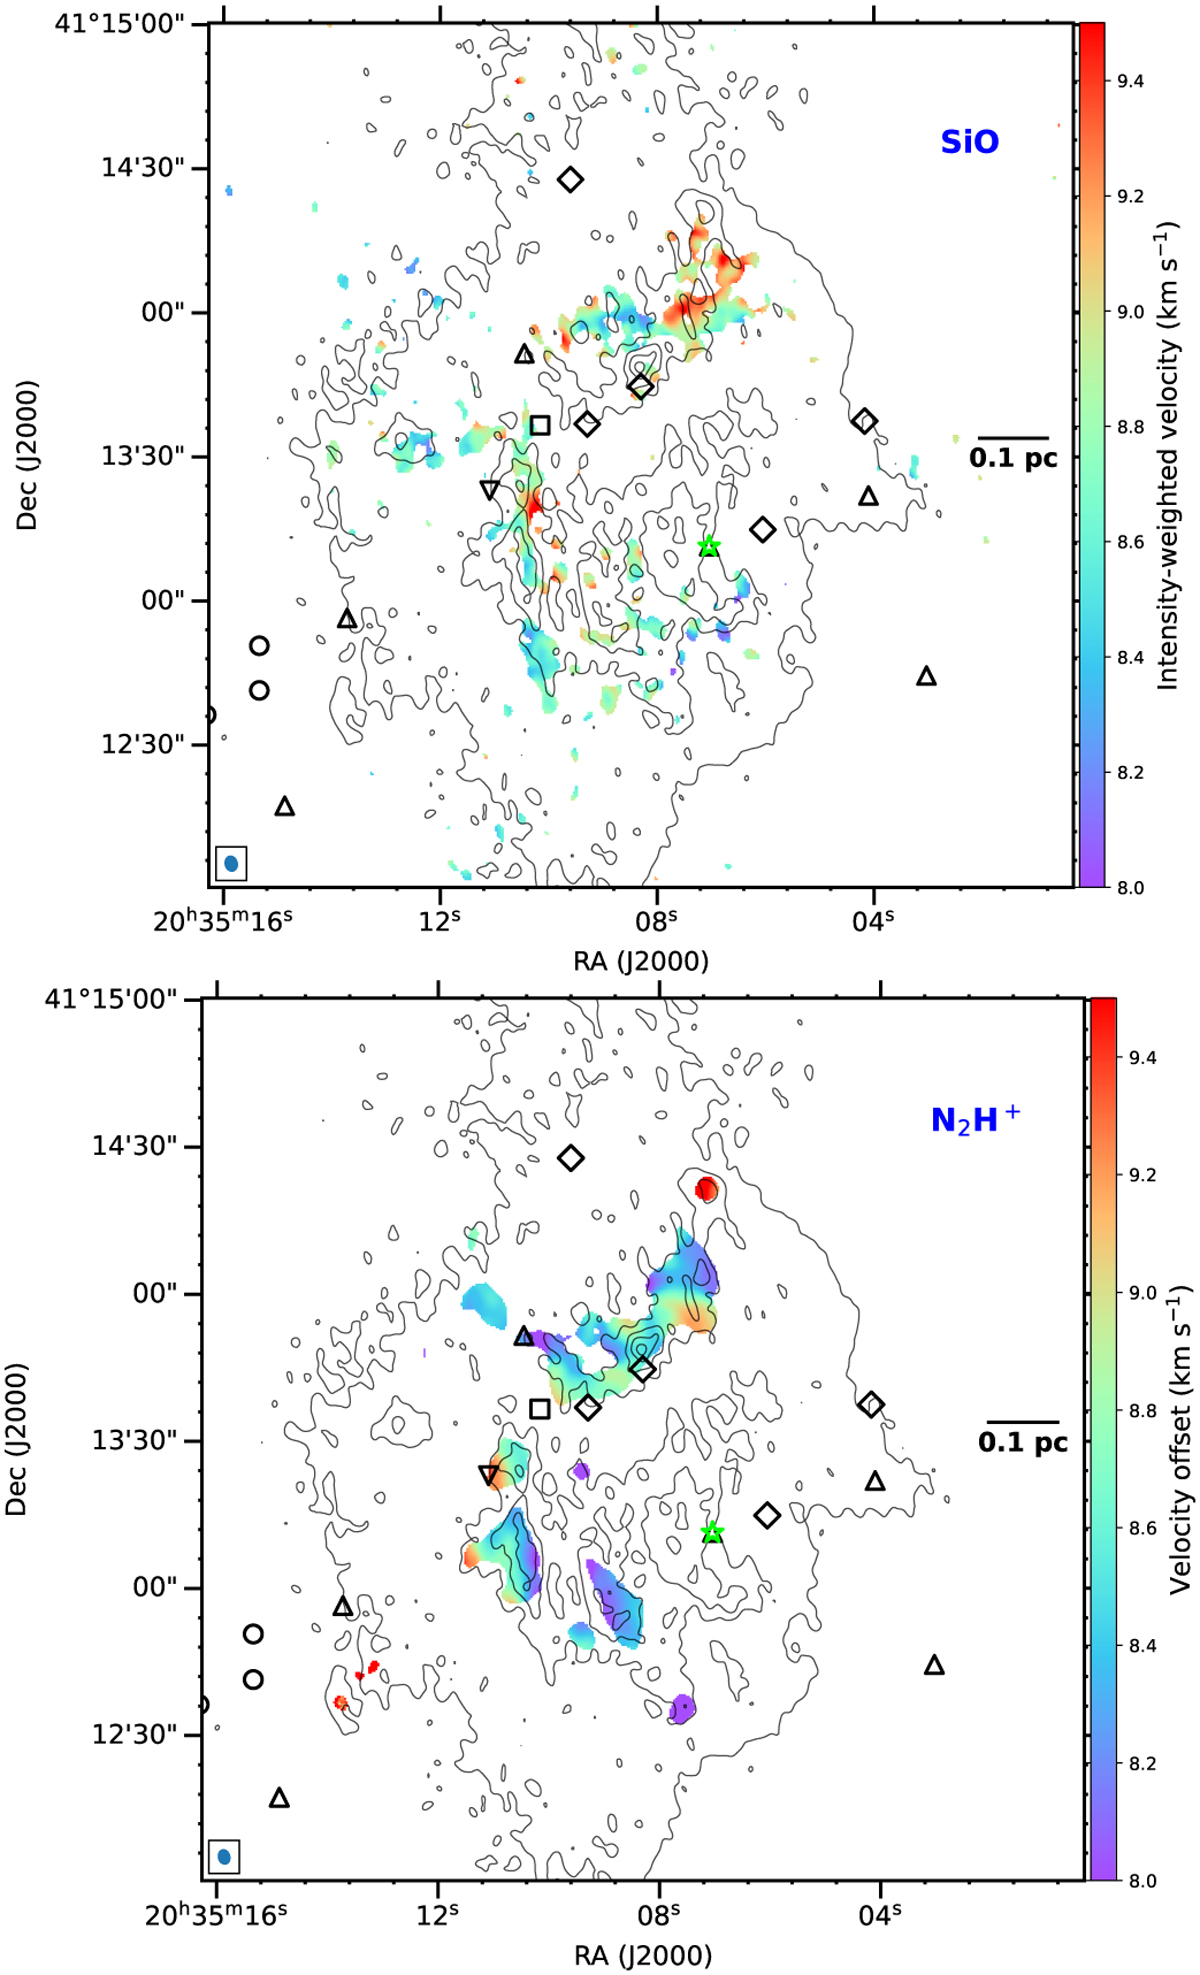
Velocity field maps of SiO (top) and N2H+ (bottom). The black contours are the 3.6 mm continuum emission. The N2H+ velocity field map is generated by fitting hyperfine structure lines of N2H+ per pixel using XCLASS while the SiO velocity map is the intensity-weighted velocity of the spectral line (i.e., moment 1 map). The black symbols are YSOs, and they are the same as presented in Fig. 2. The velocity ranges in the color bars for both maps are fixed as the same.
Current usage metrics show cumulative count of Article Views (full-text article views including HTML views, PDF and ePub downloads, according to the available data) and Abstracts Views on Vision4Press platform.
Data correspond to usage on the plateform after 2015. The current usage metrics is available 48-96 hours after online publication and is updated daily on week days.
Initial download of the metrics may take a while.