Fig. 13
Download original image
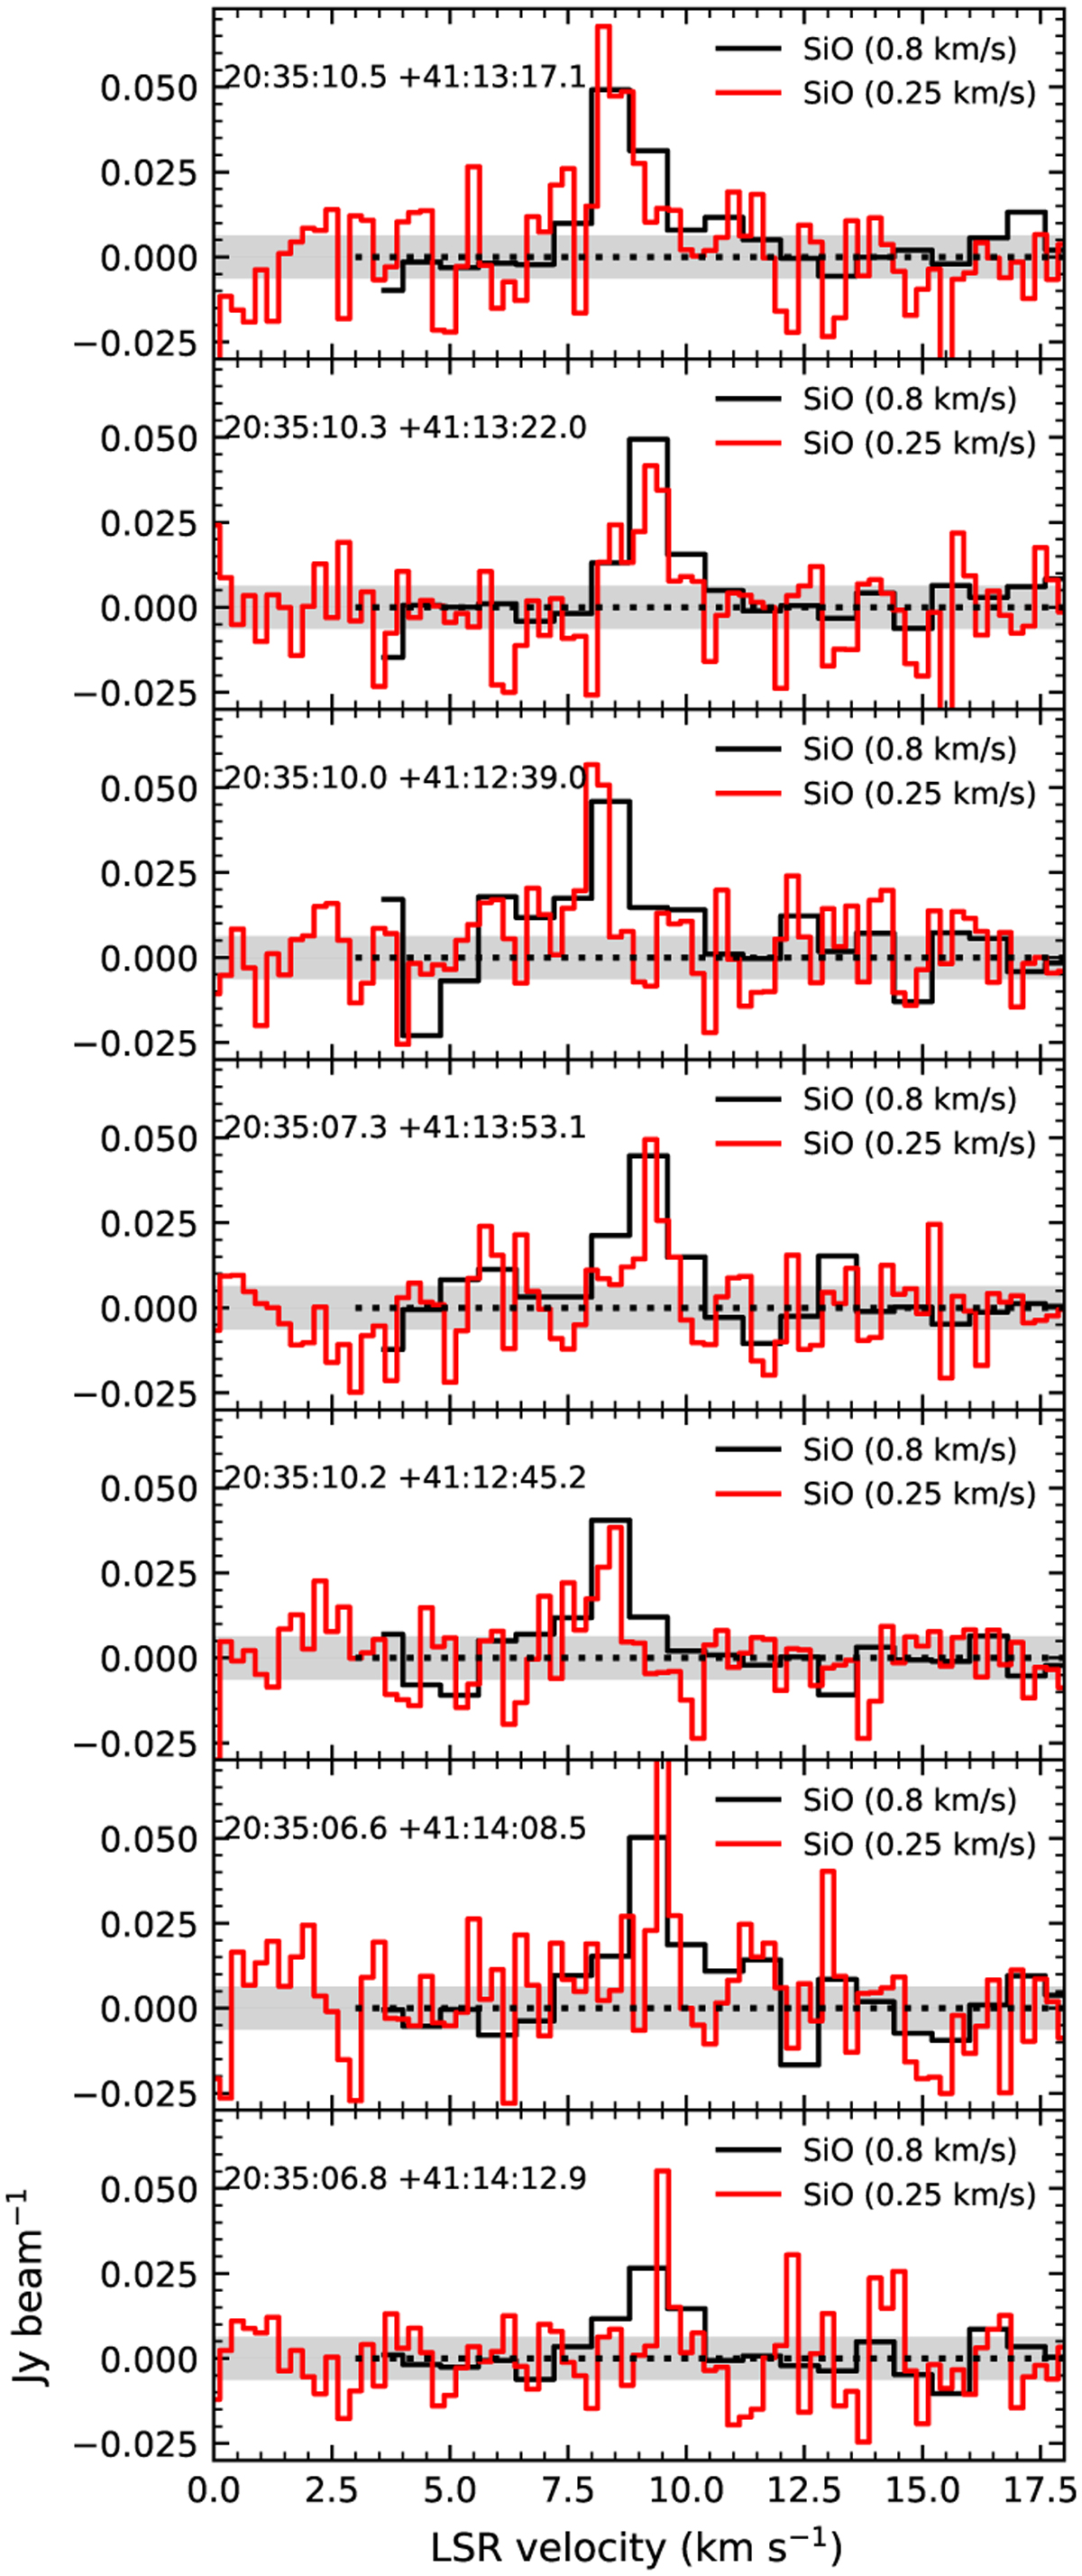
SiO spectral lines extracted from the NOEMA+30 m combined data (black curves) and the NOEAM-alone data (red curves). The combined data has a channel width of 0.8 km s−1 while the NOEMA-only data provides a narrower channel width of 0.25 km s−1. The coordinates of each extracted position on the SiO intensity map are individually displayed on each panel.
Current usage metrics show cumulative count of Article Views (full-text article views including HTML views, PDF and ePub downloads, according to the available data) and Abstracts Views on Vision4Press platform.
Data correspond to usage on the plateform after 2015. The current usage metrics is available 48-96 hours after online publication and is updated daily on week days.
Initial download of the metrics may take a while.