Fig. 11
Download original image
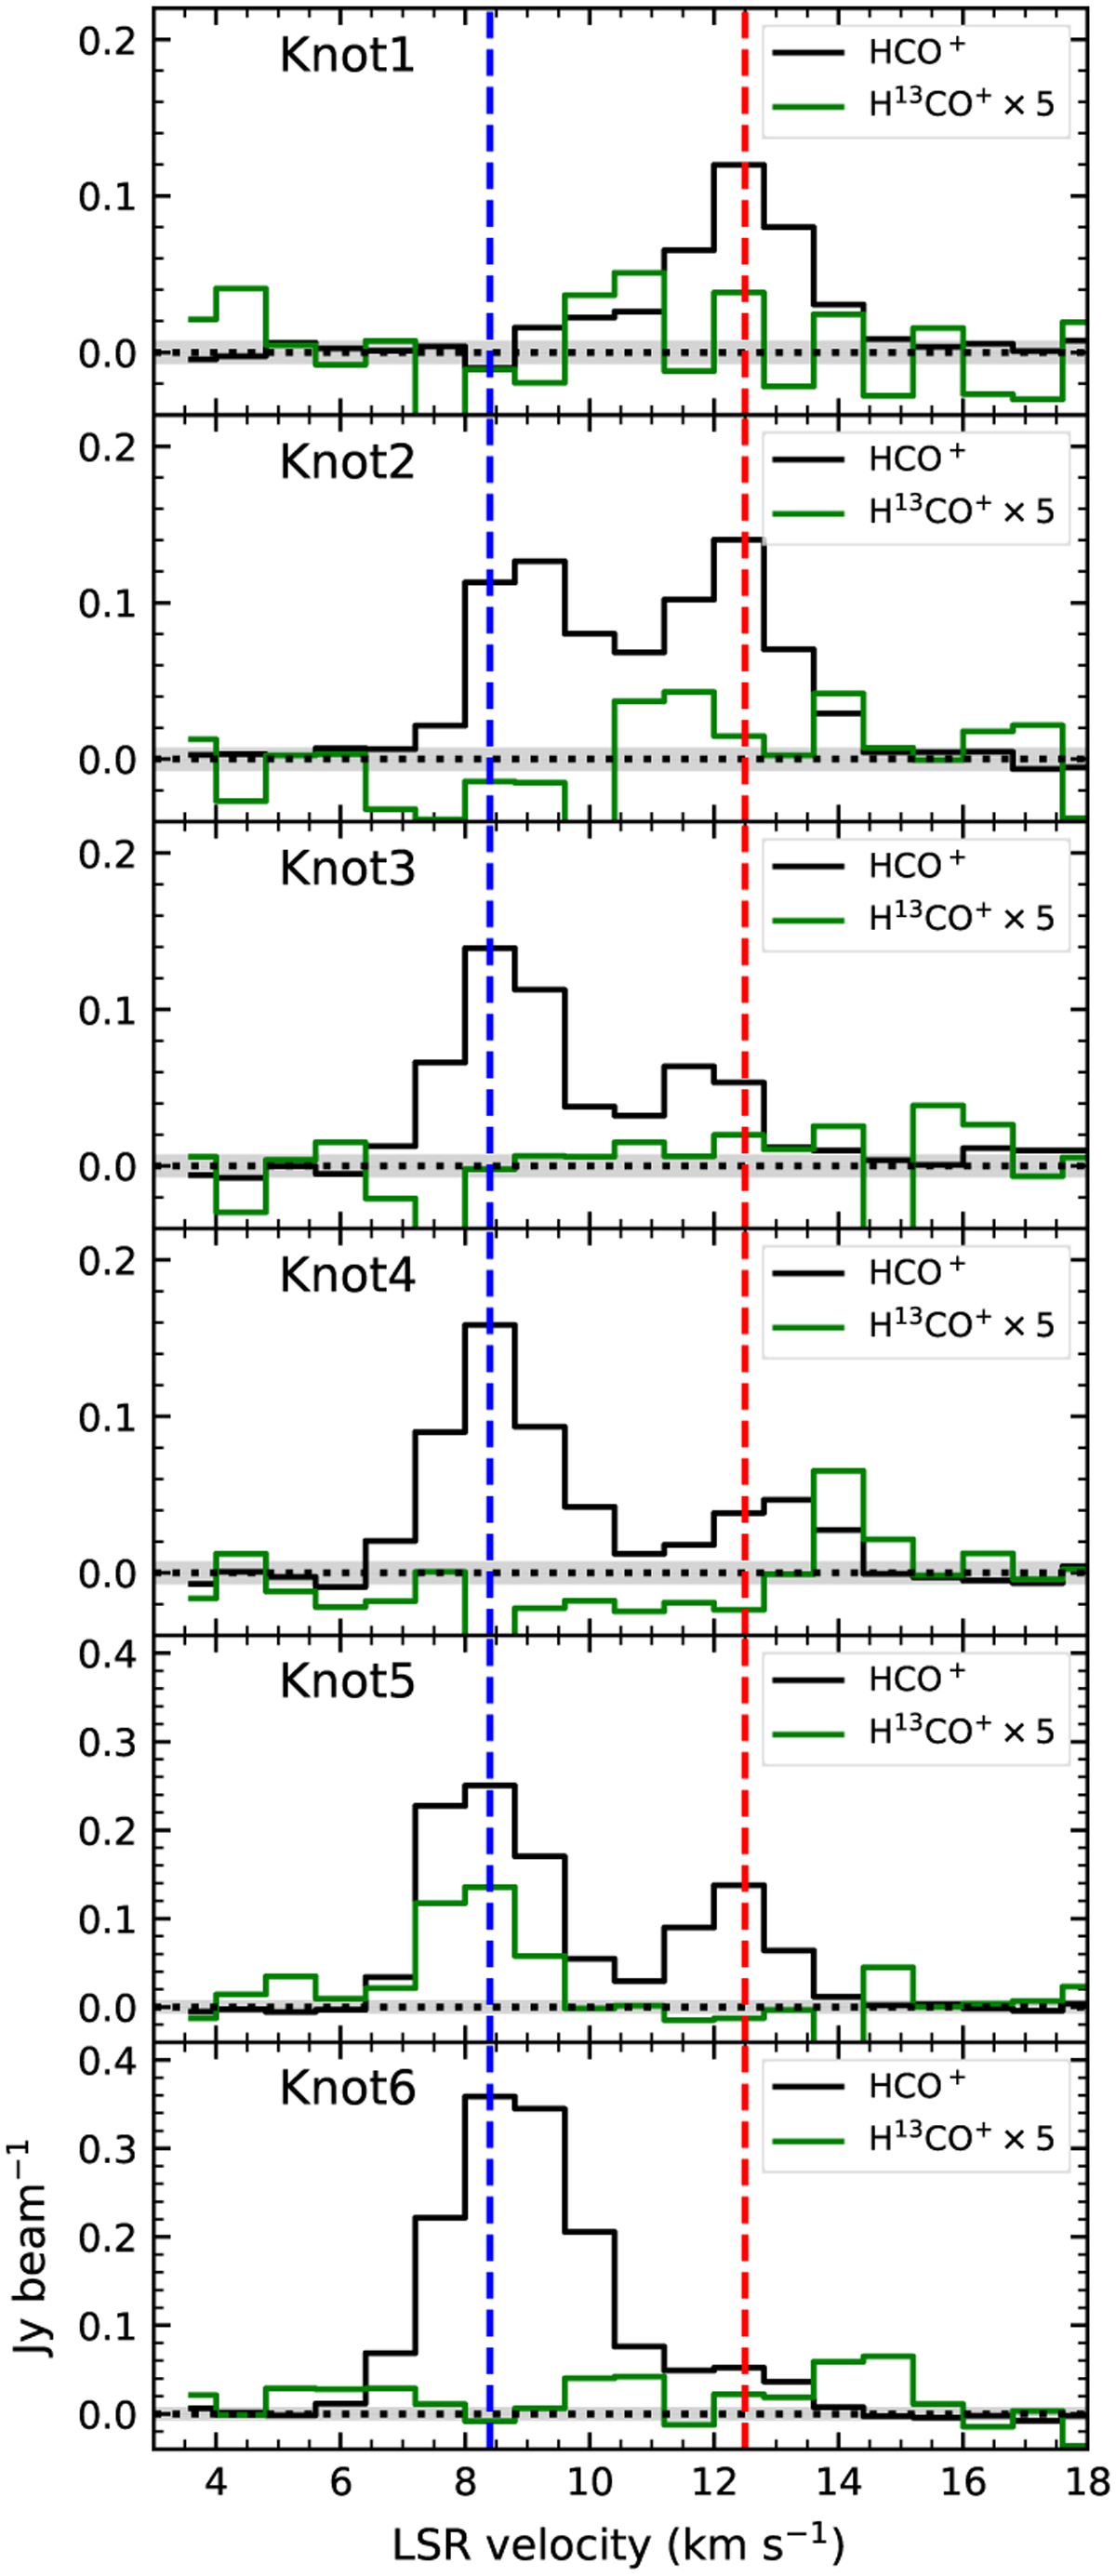
HCO+ (black) and H13CO+ (green) spectral lines extracted over an area with a diameter of 2 × θbeam toward pronounced bright knot features marked on the velocity channel map at 12.5 km s−1 in Fig. 10. The blue dashed-vertical lines indicate the systemic velocity of DR18, and the red dashed lines have a velocity of 12.5 km s−1. The gray filled areas indicate ±1σrms (= 7.15 mJy beam−1) for HCO+.
Current usage metrics show cumulative count of Article Views (full-text article views including HTML views, PDF and ePub downloads, according to the available data) and Abstracts Views on Vision4Press platform.
Data correspond to usage on the plateform after 2015. The current usage metrics is available 48-96 hours after online publication and is updated daily on week days.
Initial download of the metrics may take a while.