Open Access
Fig. 9
Download original image
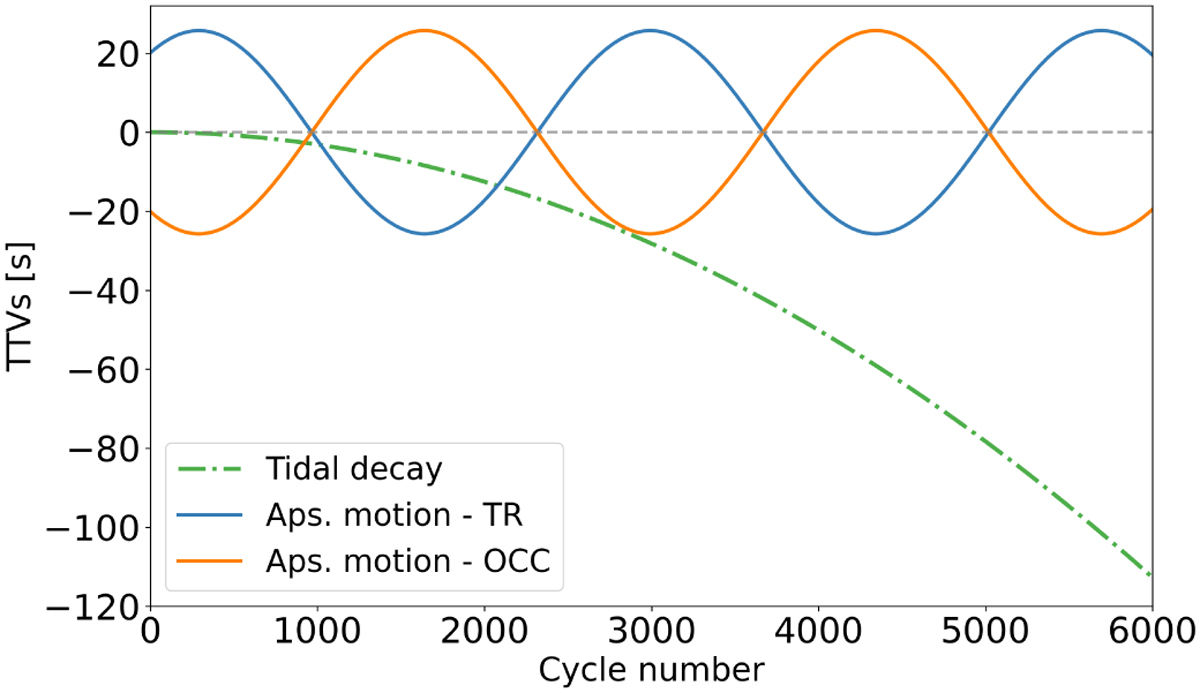
Transit timing variations caused by the measured tidal decay (dashed-dotted line in green) and apsidal motion contributions (respectively in blue for transit mid-times and orange for occultation mid-times) for the ≃ 10 years of transit and occultation data used in this paper.
Current usage metrics show cumulative count of Article Views (full-text article views including HTML views, PDF and ePub downloads, according to the available data) and Abstracts Views on Vision4Press platform.
Data correspond to usage on the plateform after 2015. The current usage metrics is available 48-96 hours after online publication and is updated daily on week days.
Initial download of the metrics may take a while.