Fig. 2
Download original image
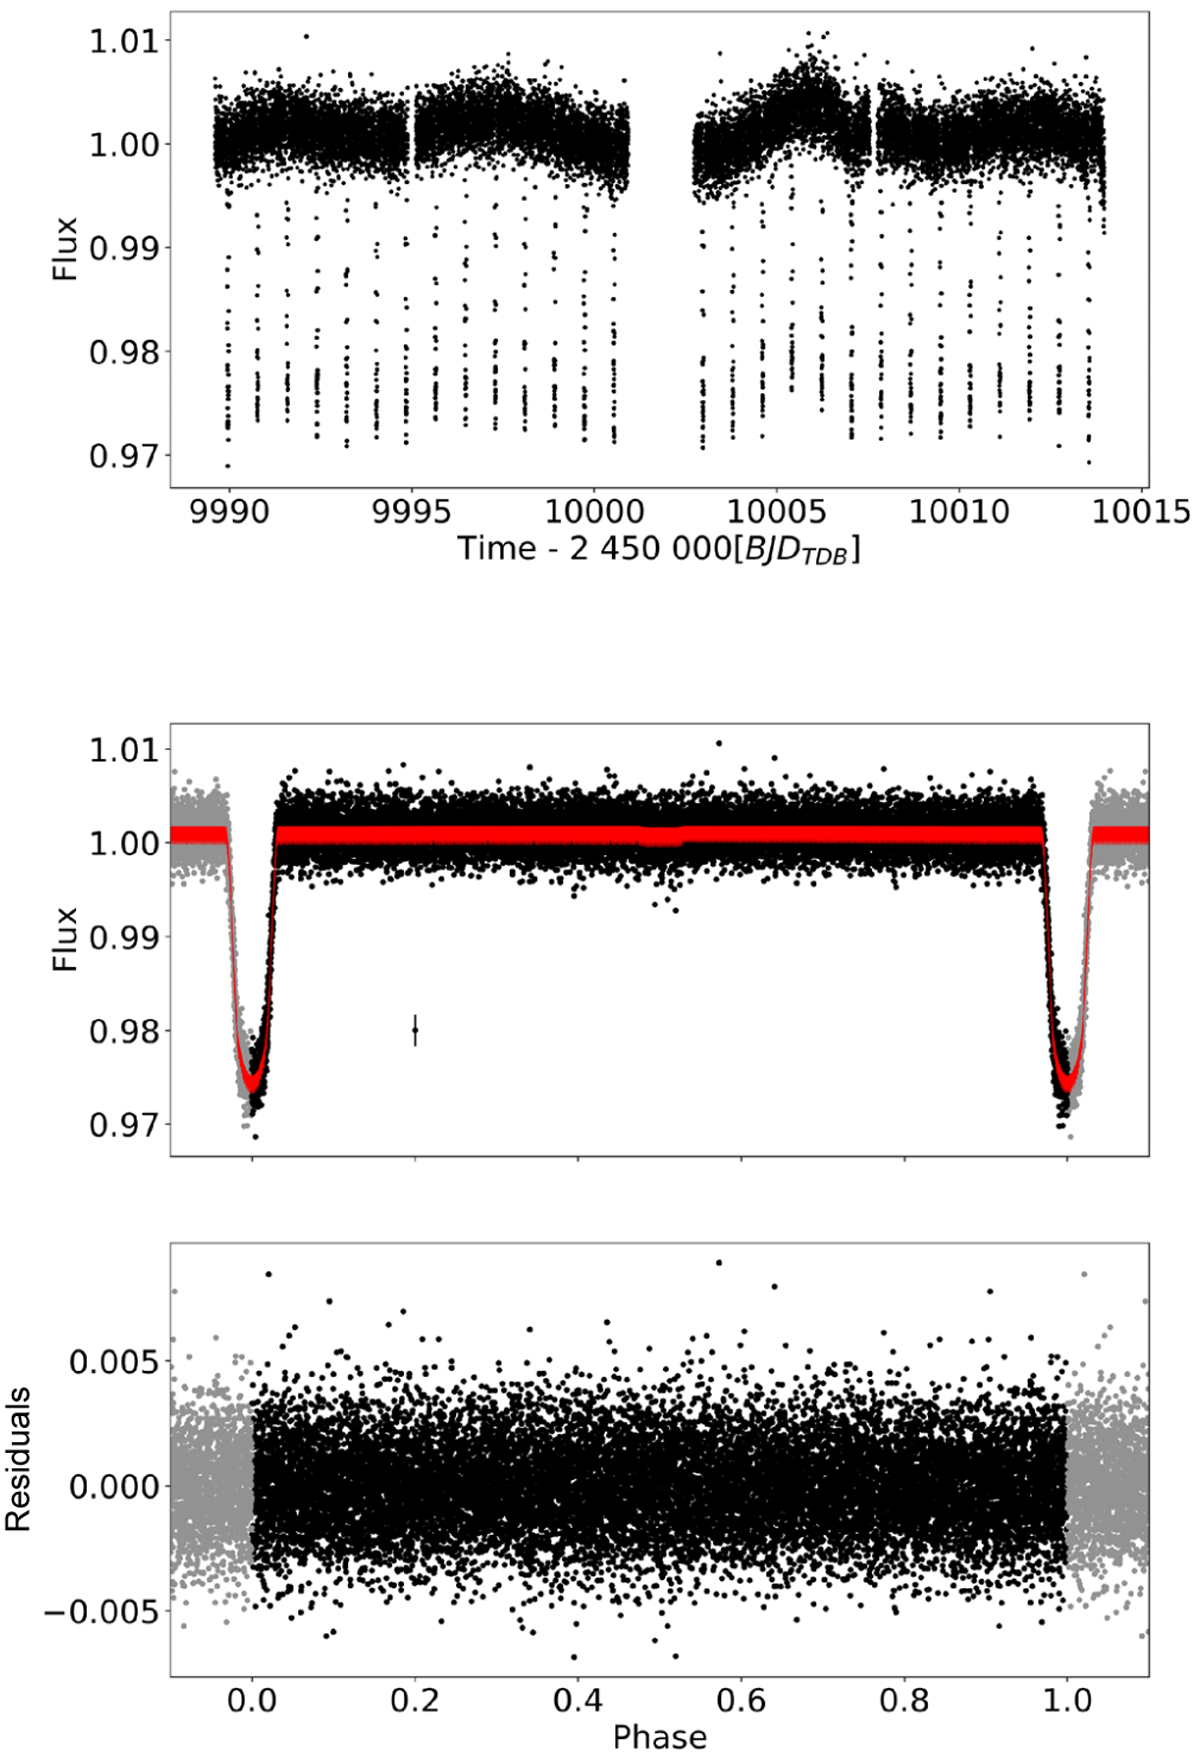
Sector 62 of TESS. Top plot: TESS 120-second full-phase observations in time. Middle plot: phase-folded data points in black and best fit in red. The typical error bar value is shown at the location (0.2,0.98). Grey points are shifted by ±1.0 in phase. The occultation is slightly visible at phase ≃0.5. Bottom plot: residuals of the fit, after having subtracted the red noise, with a standard deviation of ≃0.0017.
Current usage metrics show cumulative count of Article Views (full-text article views including HTML views, PDF and ePub downloads, according to the available data) and Abstracts Views on Vision4Press platform.
Data correspond to usage on the plateform after 2015. The current usage metrics is available 48-96 hours after online publication and is updated daily on week days.
Initial download of the metrics may take a while.