Open Access
Fig. 13
Download original image
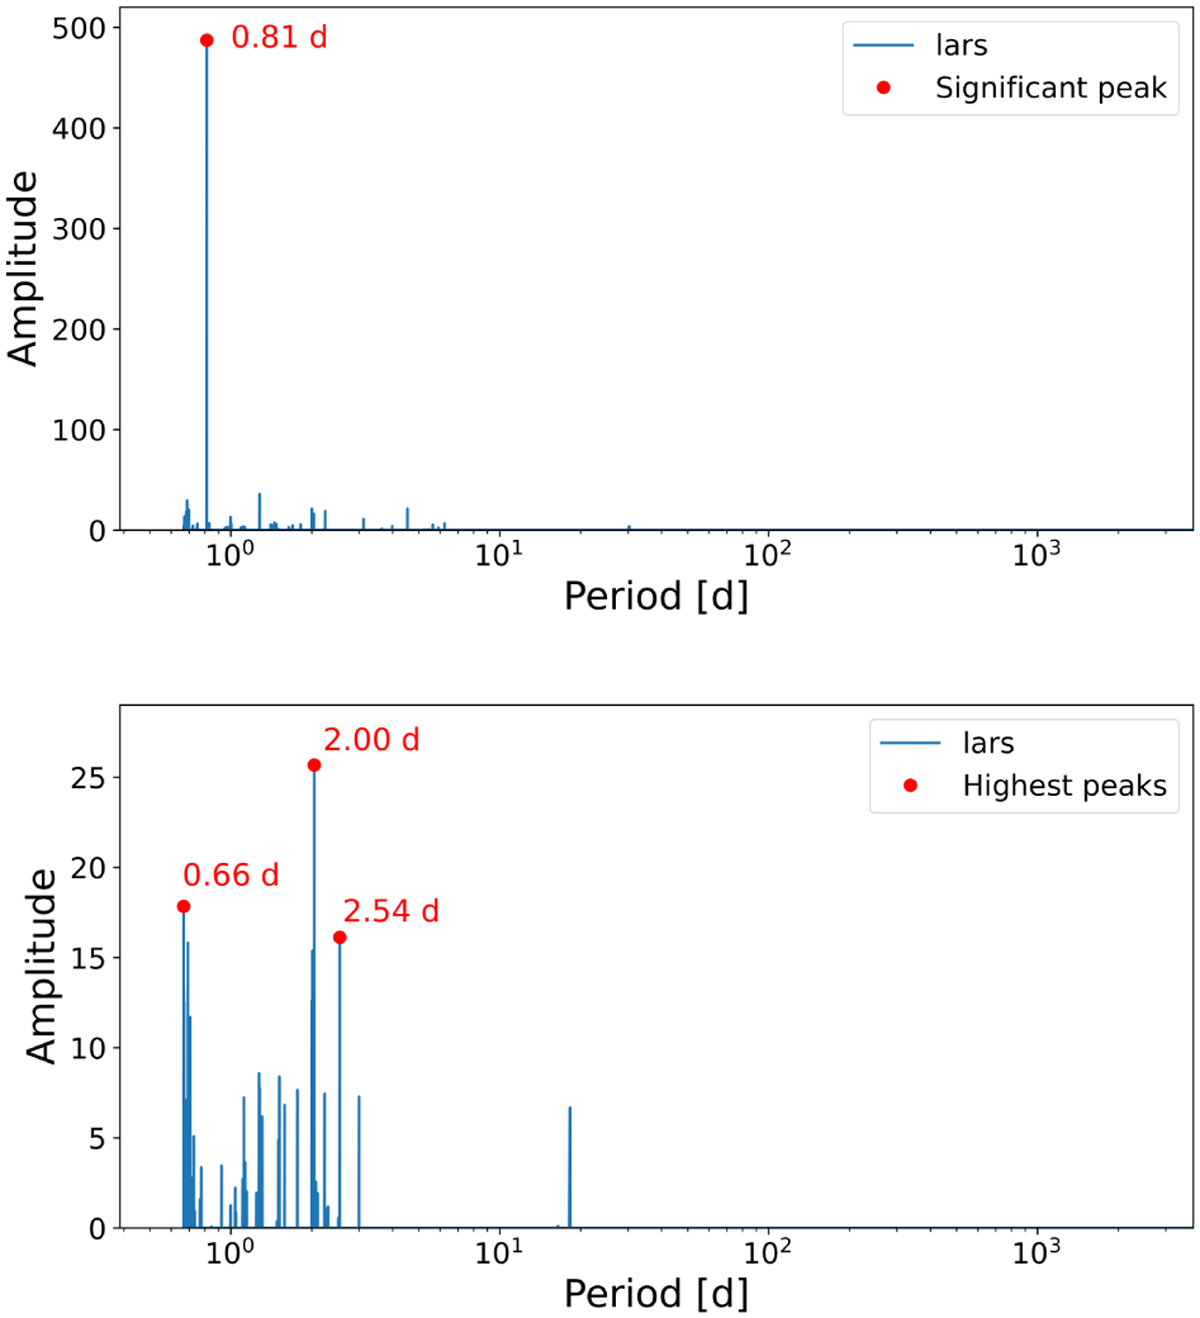
Periodograms of RVs. Top plot: periodogram of the RV dataset showing the only significant peak at ≃0.814 days, corresponding to the orbital period of WASP-43b. Bottom plot: periodogram of the residuals showing the three highest peaks, which do not pass the FAP test with a threshold at 1%.
Current usage metrics show cumulative count of Article Views (full-text article views including HTML views, PDF and ePub downloads, according to the available data) and Abstracts Views on Vision4Press platform.
Data correspond to usage on the plateform after 2015. The current usage metrics is available 48-96 hours after online publication and is updated daily on week days.
Initial download of the metrics may take a while.