Fig. 1
Download original image
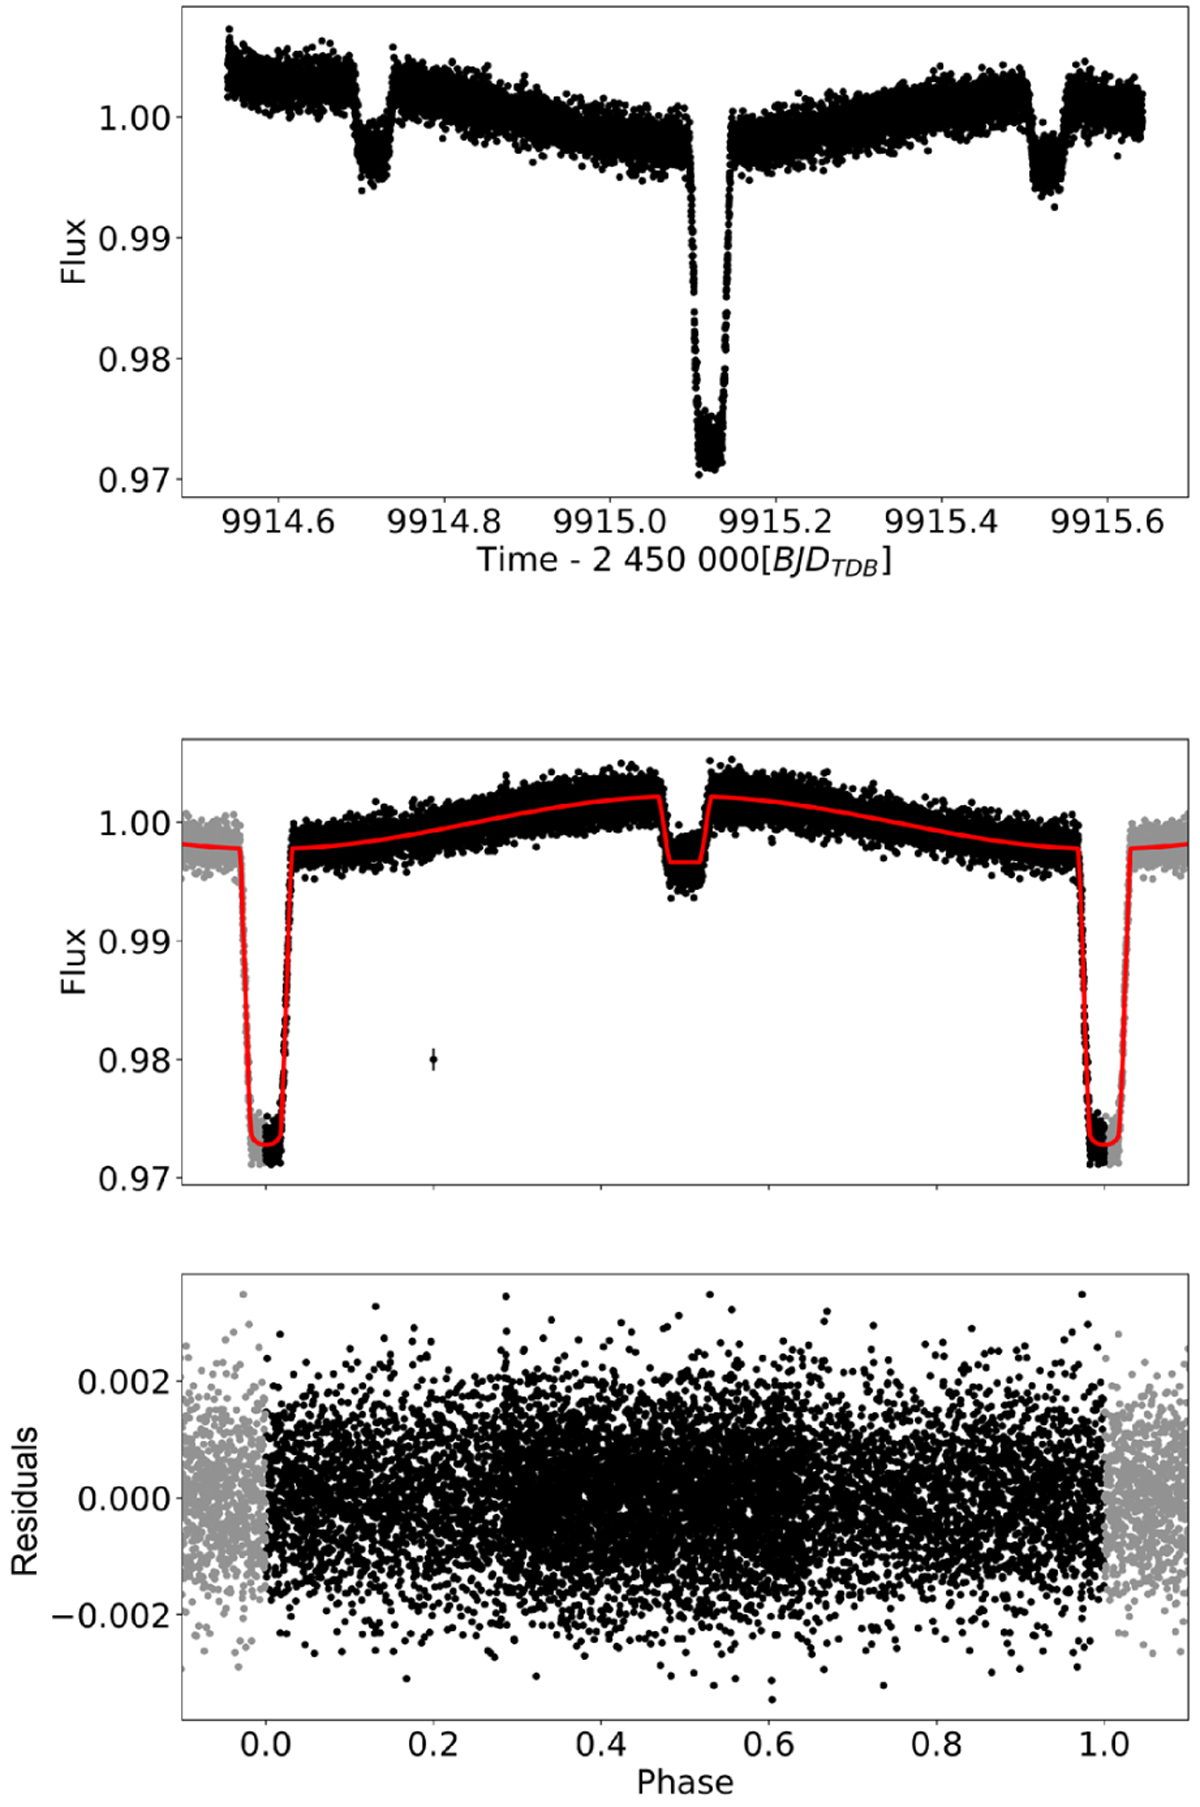
James Webb Space Telescope transit and occultations. Top plot: JWST full-phase observations in time. Middle plot: phase-folded data points in black and best fit in red. To keep the figure clean, error bars are not plotted, but a typical error bar value is shown at the location (0.2,0.98). Grey points are the same as black points but shifted by ±1.0 in phase to make the full phase clearer. Bottom plot: residuals of the fit, after having subtracted the red noise, with a standard deviation of ≃0.00097.
Current usage metrics show cumulative count of Article Views (full-text article views including HTML views, PDF and ePub downloads, according to the available data) and Abstracts Views on Vision4Press platform.
Data correspond to usage on the plateform after 2015. The current usage metrics is available 48-96 hours after online publication and is updated daily on week days.
Initial download of the metrics may take a while.