Fig. 4.
Download original image
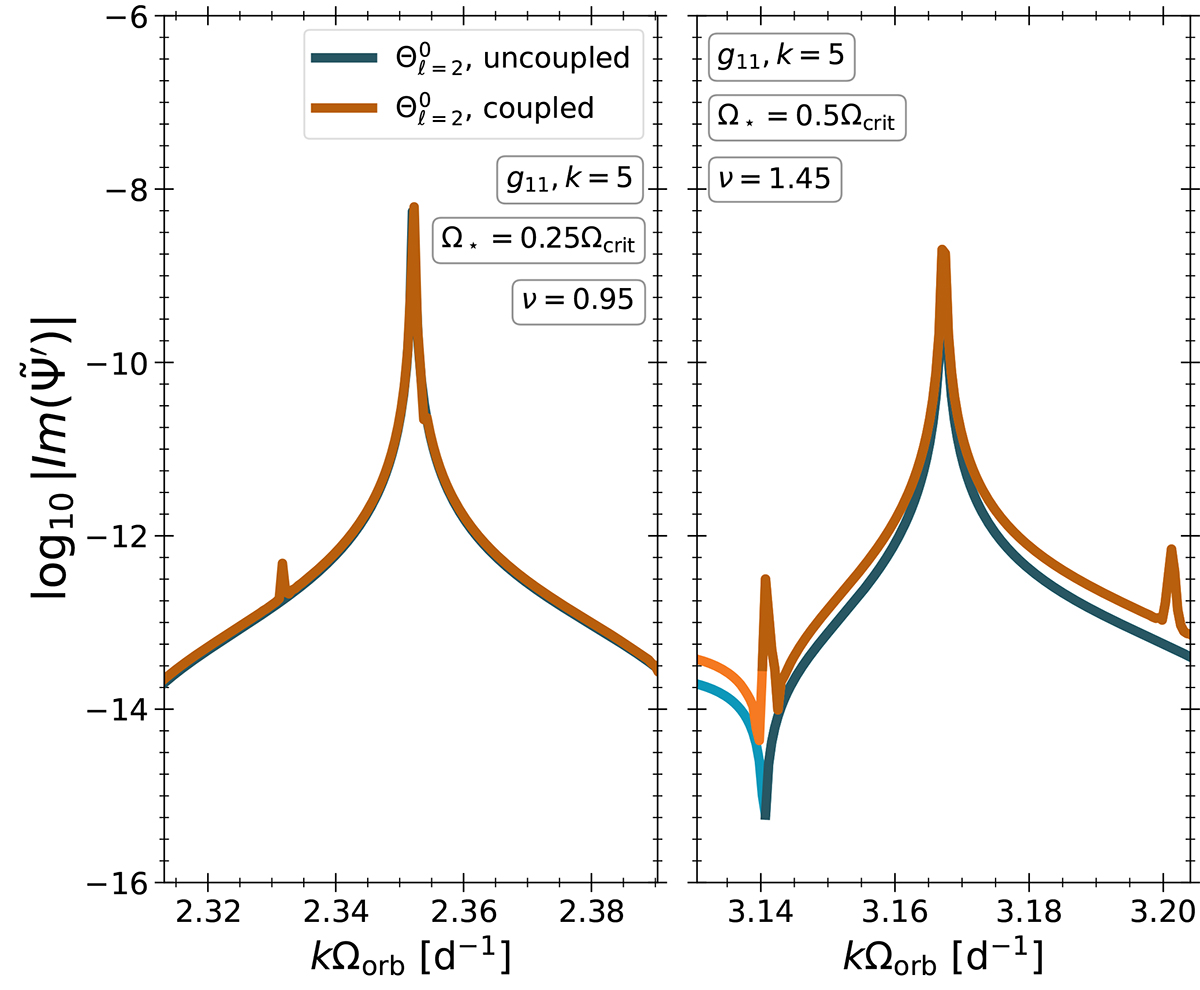
Surface imaginary part of the potential perturbation for the ℓ = 2, m = 0, n = 11, k = 5 oscillation mode. The left panel corresponds to a case where the stellar rotation frequency is 0.25 Ωcrit = 1.15 d−1, while in the right panel the stellar rotation frequency is 0.5 Ωcrit = 2.29 d−1. The orange curves correspond to the results of the coupled oscillation code, while the blue curves correspond to the solution from the uncoupled oscillation code. The dark curves correspond to negative values of the potential perturbation while the lighter curves corresponds to positive values.
Current usage metrics show cumulative count of Article Views (full-text article views including HTML views, PDF and ePub downloads, according to the available data) and Abstracts Views on Vision4Press platform.
Data correspond to usage on the plateform after 2015. The current usage metrics is available 48-96 hours after online publication and is updated daily on week days.
Initial download of the metrics may take a while.