Open Access
Fig. 8
Download original image
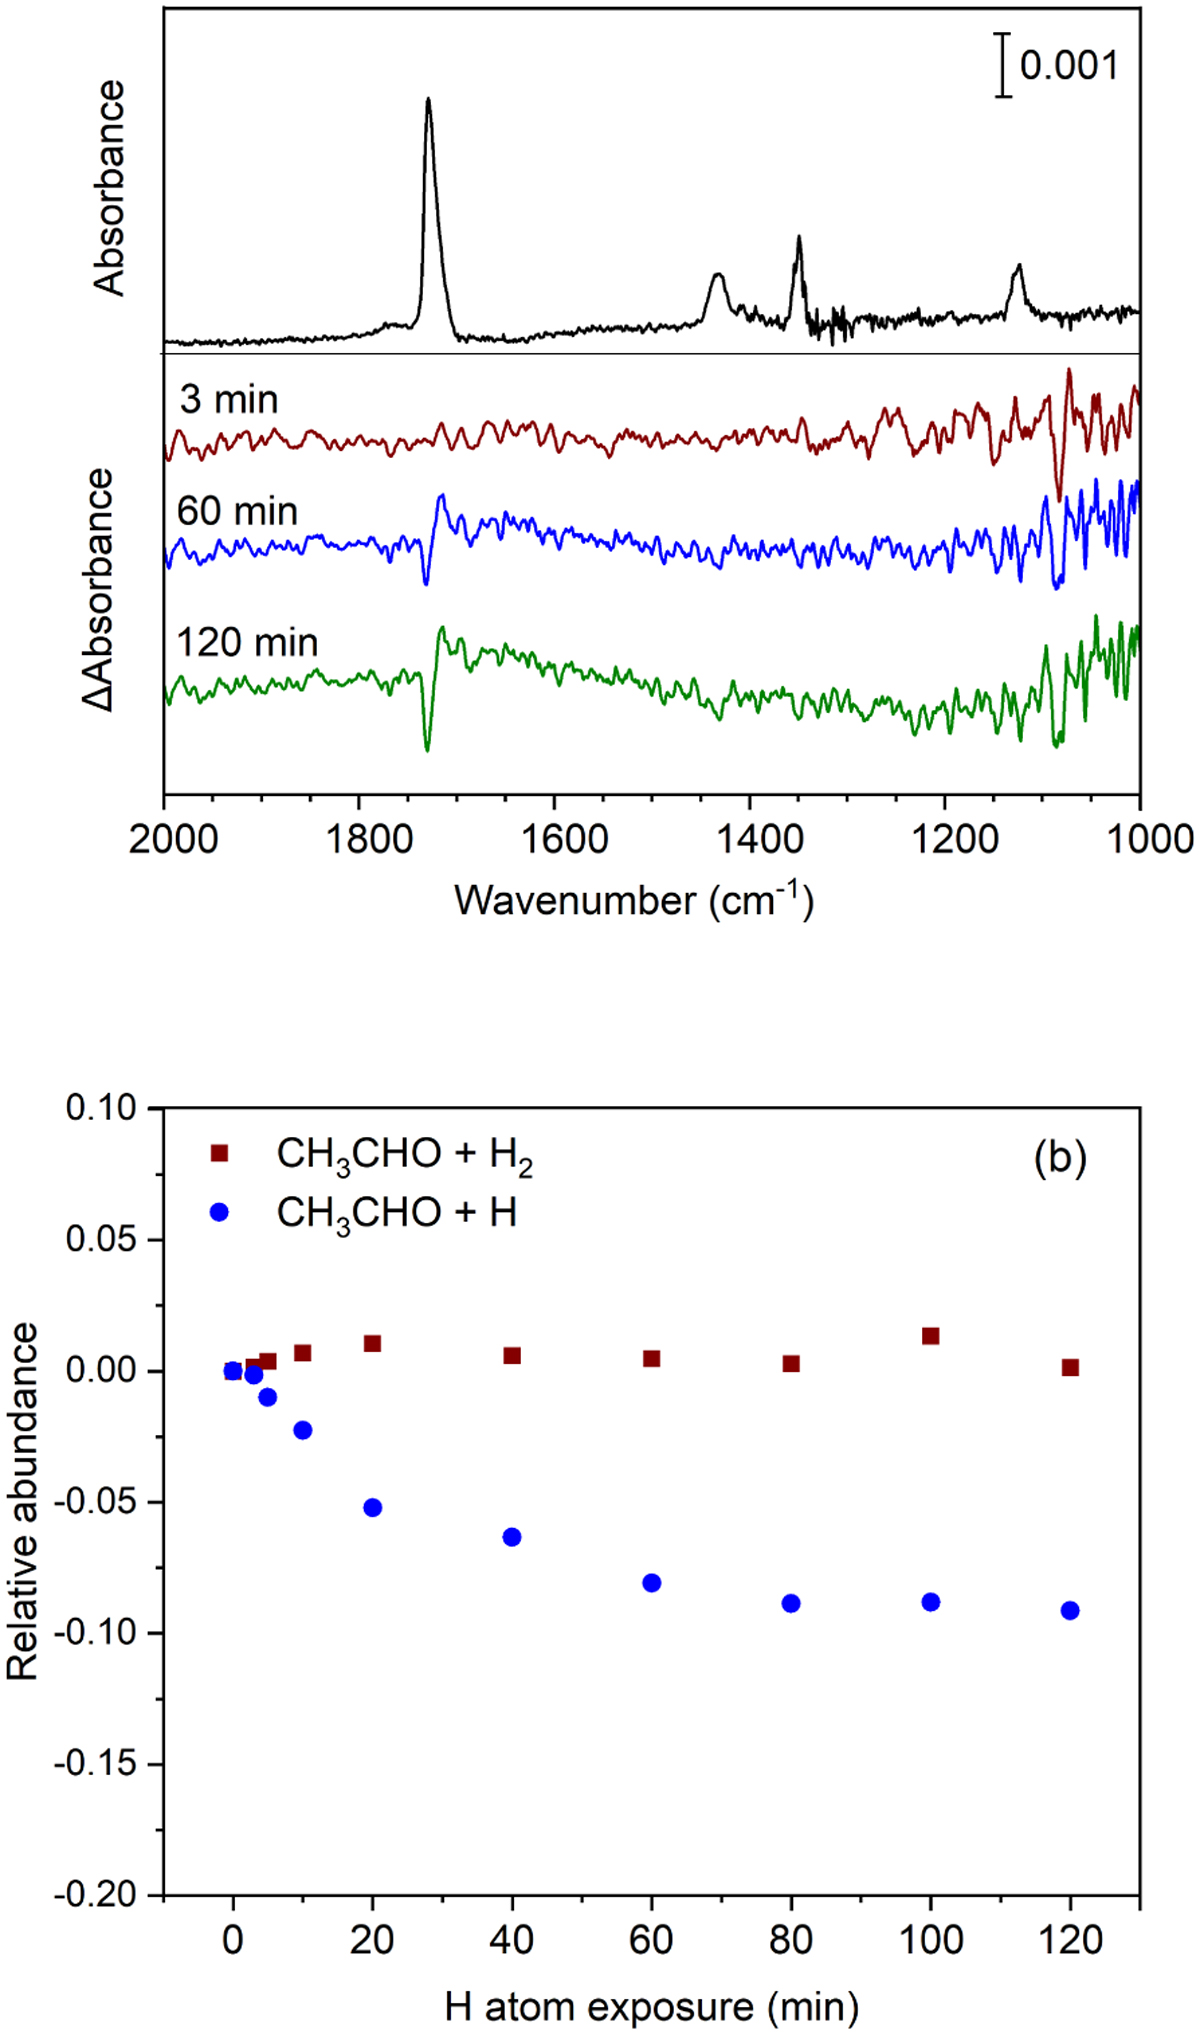
(a) Variation in the difference spectra of the solid CH3CHO after exposure to H atoms for 3, 60, and 120 min at 10 K. (b) Relative abundance of CH3CHO following a 2-hour exposure to H atoms (blue circles) compared to that with H2 molecules (red squares) on c-ASW at 10 K.
Current usage metrics show cumulative count of Article Views (full-text article views including HTML views, PDF and ePub downloads, according to the available data) and Abstracts Views on Vision4Press platform.
Data correspond to usage on the plateform after 2015. The current usage metrics is available 48-96 hours after online publication and is updated daily on week days.
Initial download of the metrics may take a while.