Fig. 5
Download original image
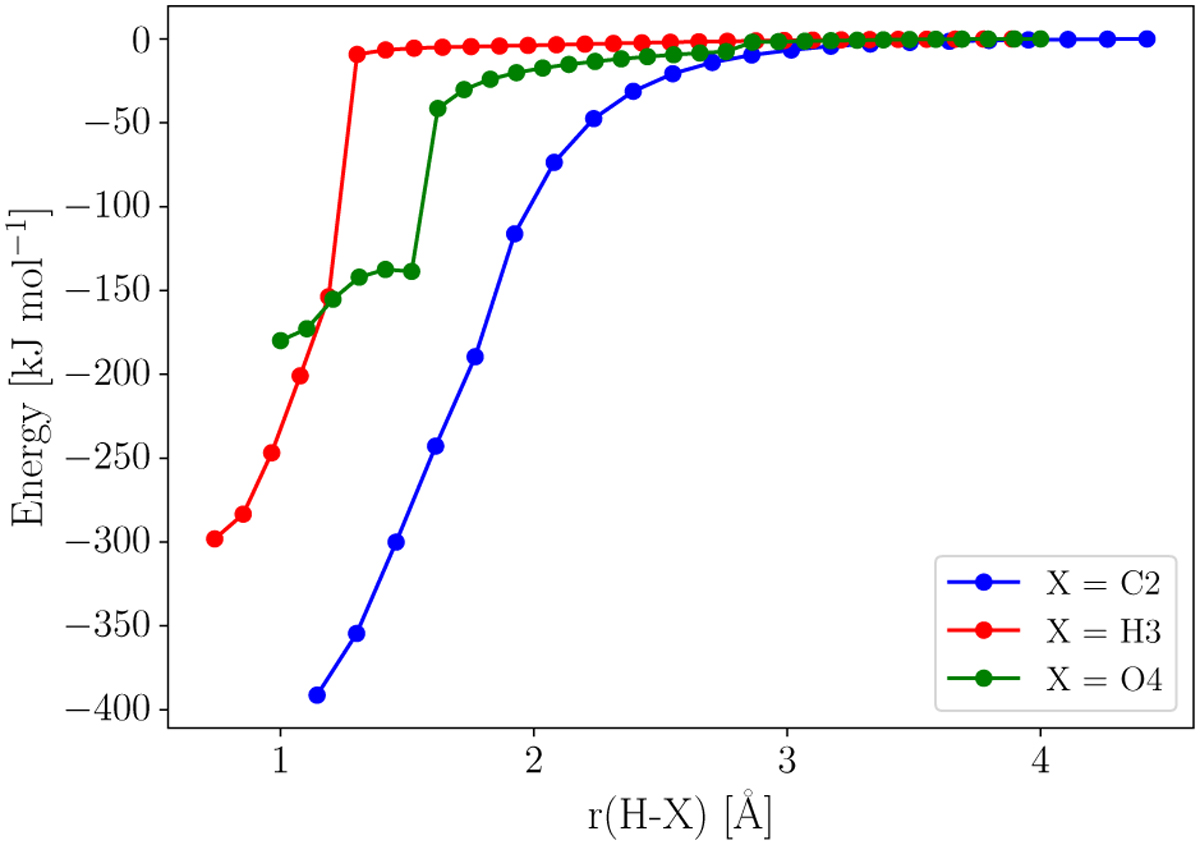
Potential energy scan for Reactions (R8) (blue curve), (R9) (red curve), and (R10) (green curve) at the revDSD-PBEP86(D4)/jun-cc- pV(T+d)z level using a broken symmetry formalism. The discontinuities in r(H-H3) and r(H-O4) are caused by the insufficient resolution of the PES scan. The small bump in r(H-O4) is attributed to the constraints in the C-H bonds required to carry out the scan (see text).
Current usage metrics show cumulative count of Article Views (full-text article views including HTML views, PDF and ePub downloads, according to the available data) and Abstracts Views on Vision4Press platform.
Data correspond to usage on the plateform after 2015. The current usage metrics is available 48-96 hours after online publication and is updated daily on week days.
Initial download of the metrics may take a while.