Open Access
Fig. 16
Download original image
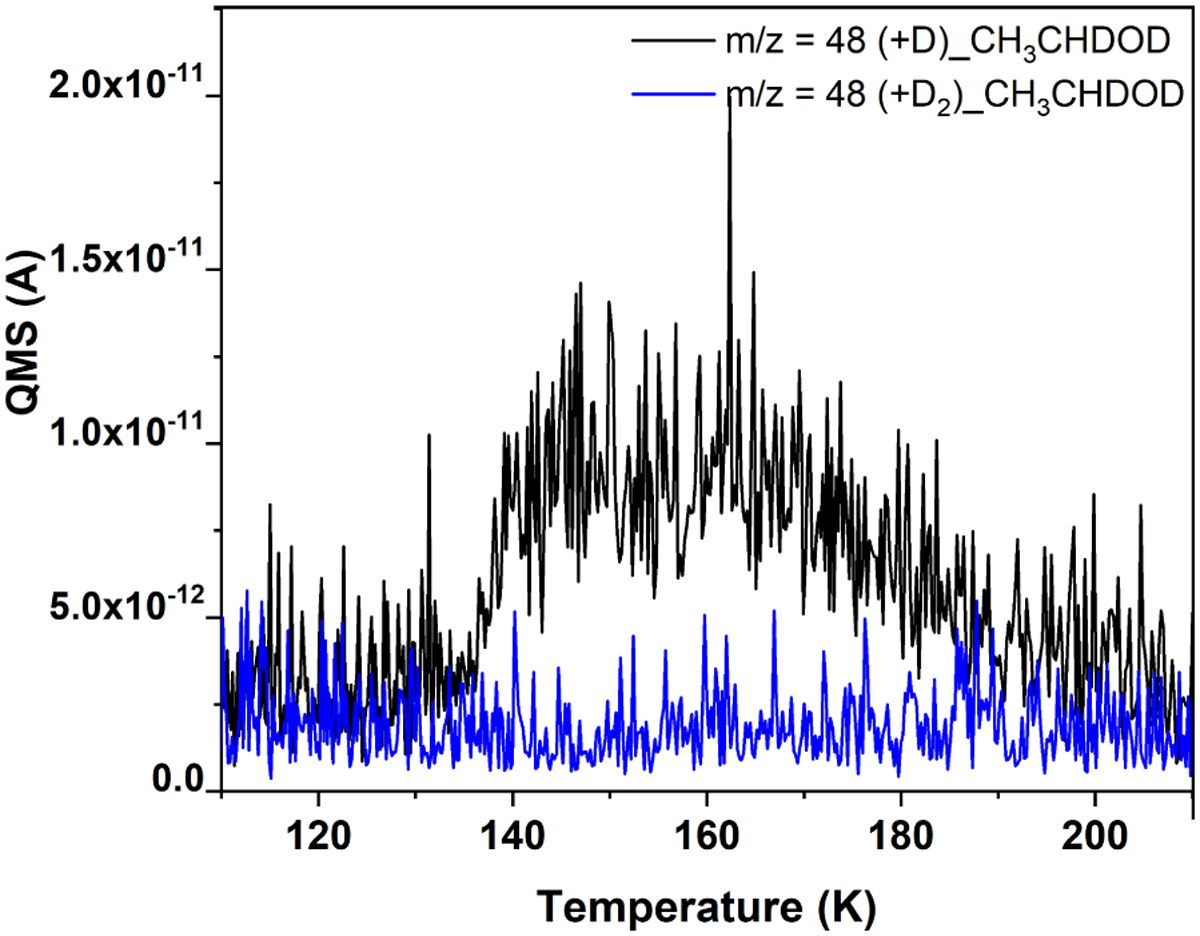
TPD-QMS profile for the desorption peak observed at m/z = 48 (black line) may be attributed to the formation of CH3CHDOD through the addition reaction of D to CH3CHO. This is in the comparison to the desorption behavior for D2 (blue line) on the Al substrate at 10 K.
Current usage metrics show cumulative count of Article Views (full-text article views including HTML views, PDF and ePub downloads, according to the available data) and Abstracts Views on Vision4Press platform.
Data correspond to usage on the plateform after 2015. The current usage metrics is available 48-96 hours after online publication and is updated daily on week days.
Initial download of the metrics may take a while.