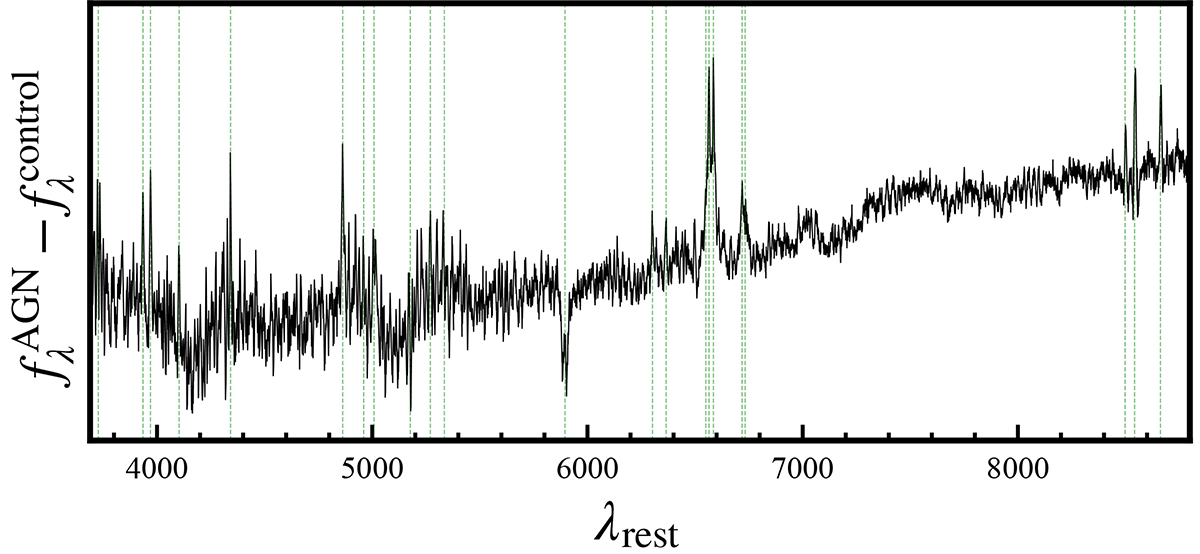
Fig. 9.
Download original image
Stacked differential spectrum between all RDAGN hosts and their controls from the nuclear regions (∼2.5″ diameter). The spectrum is shown over the rest-frame wavelength range 3700 Å−8800 Å. This wavelength range covers the most prominent emission and absorption lines from [O II]λ3727 to Ca IIλ8662, which are indicated by green dashed lines. The emission-like or absorption-like features indicate that those emission lines are stronger or weaker (respectively) in RDAGN hosts than in their control galaxy stacks. The most prominent features of emission line excess are from [N II]λ6550, 6585 and Hα. This kind of differential stacked spectra are created for different regions and different RDAGN populations, and are analyzed in Sect. 4.3.
Current usage metrics show cumulative count of Article Views (full-text article views including HTML views, PDF and ePub downloads, according to the available data) and Abstracts Views on Vision4Press platform.
Data correspond to usage on the plateform after 2015. The current usage metrics is available 48-96 hours after online publication and is updated daily on week days.
Initial download of the metrics may take a while.