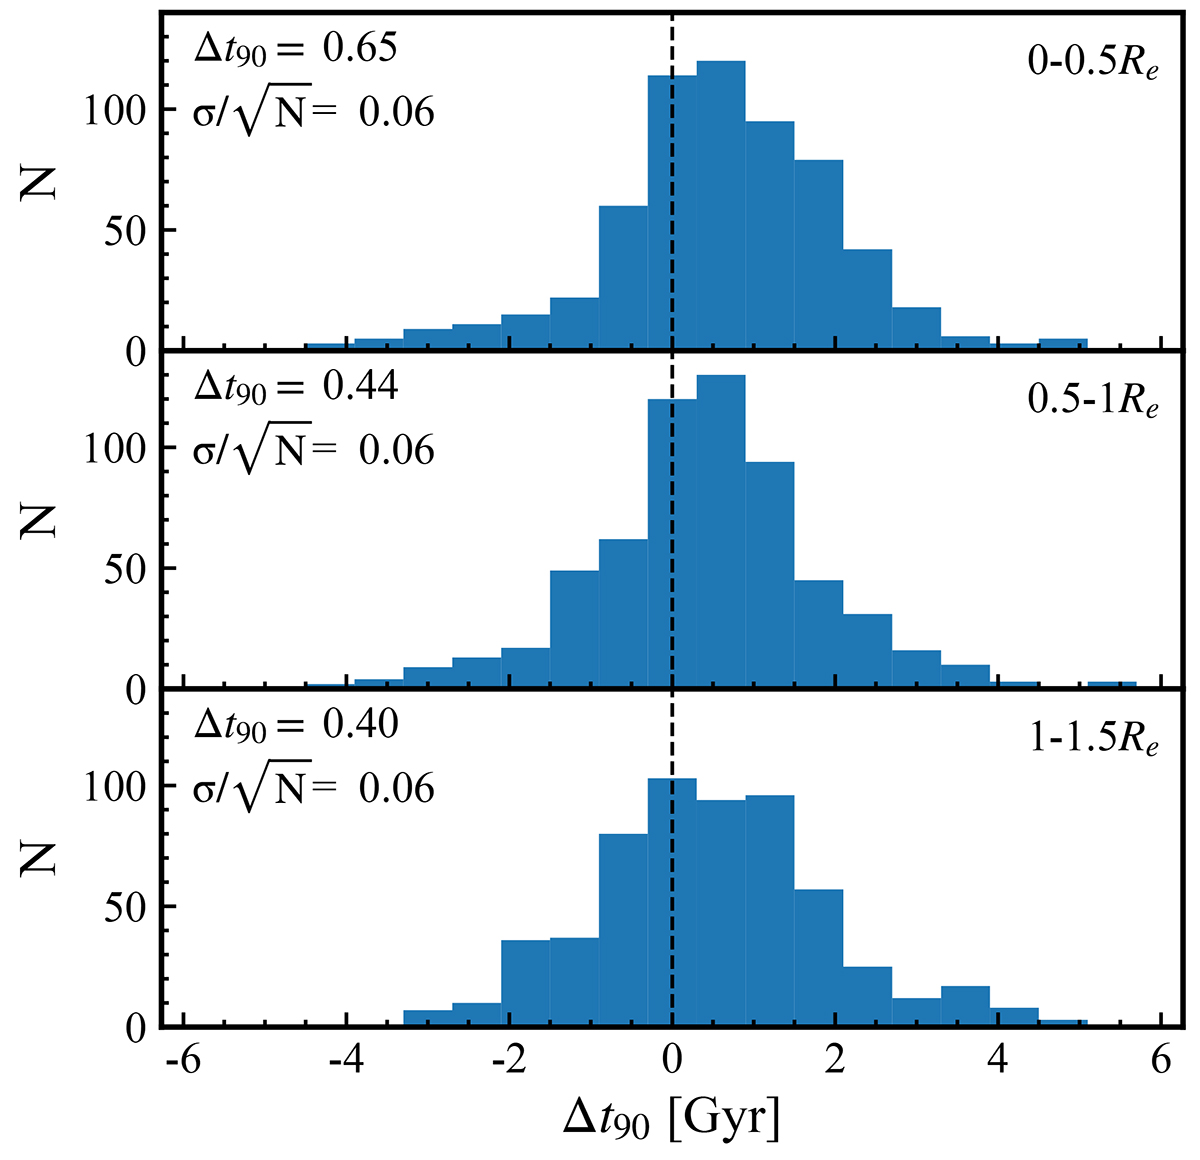
Fig. 8.
Download original image
Distributions of the difference between the t90 from RDAGN and their controls. The three panels from top to bottom are the results for the inner, middle, and outer regions of galaxies. The median difference and its error (standard deviation divided by the square root of the sample size) are noted in the top left of each panel. Larger t90s indicate that RDAGN hosts globally become quenched earlier.
Current usage metrics show cumulative count of Article Views (full-text article views including HTML views, PDF and ePub downloads, according to the available data) and Abstracts Views on Vision4Press platform.
Data correspond to usage on the plateform after 2015. The current usage metrics is available 48-96 hours after online publication and is updated daily on week days.
Initial download of the metrics may take a while.