Fig. 6.

Download original image
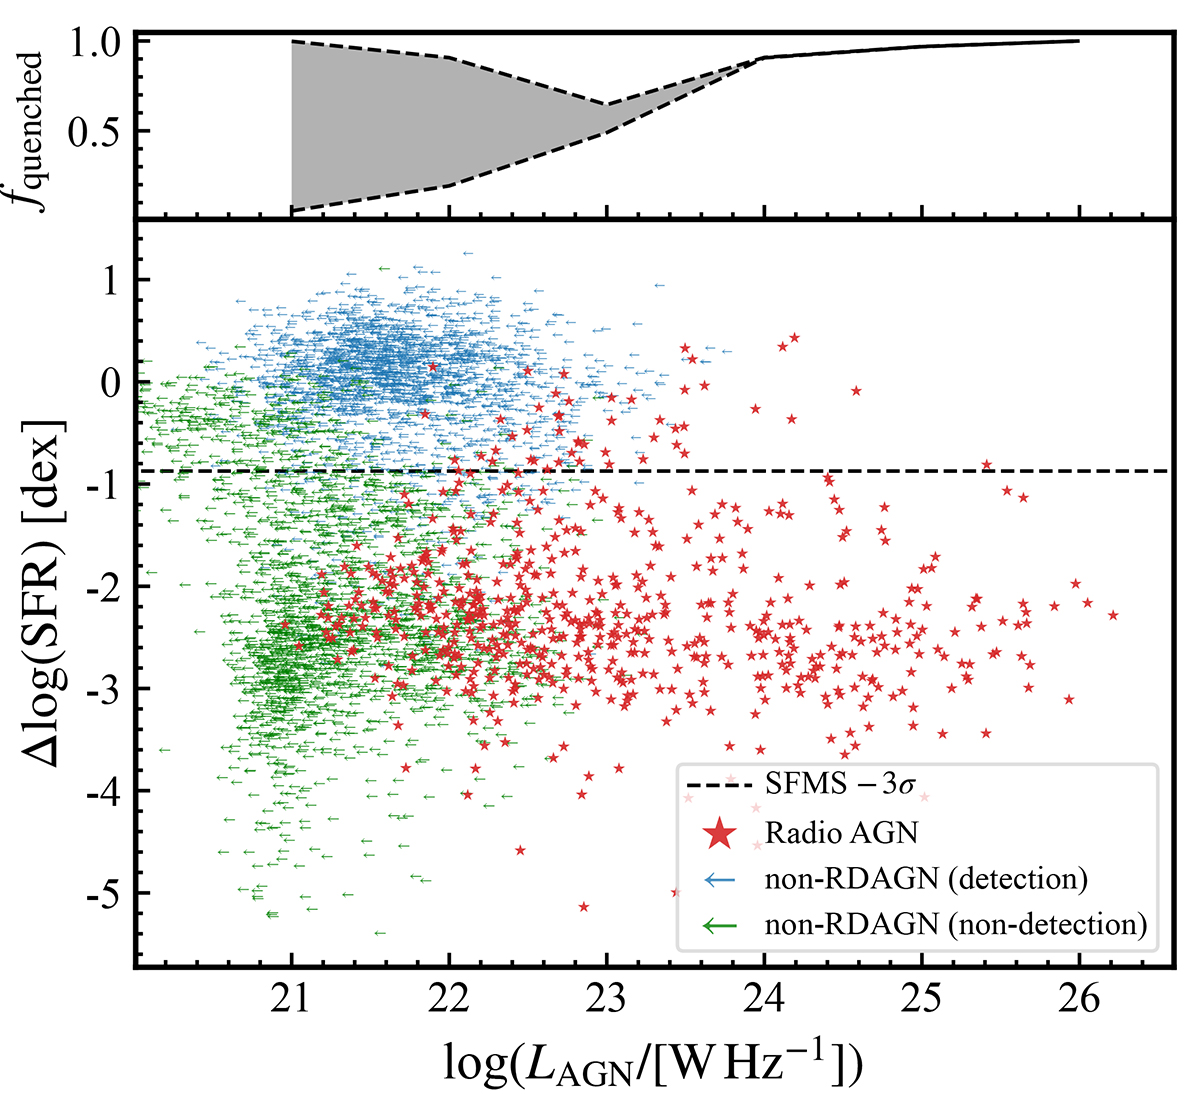
Quenching level (ΔSFR compared to the main sequence SFR at the same stellar mass) of MaNGA galaxies as a function of their radio AGN luminosities (or the upper limits). The LAGN upper limits of nondetections and are plotted as green arrows. The upper limits of non-RDAGN detections are calculated based on the star formation contribution to the total radio luminosity and are shown as blue arrows. Below the black line (3σ lower than the SFMS) are quenched galaxies. The lack of galaxies in the upper right panel indicates that almost all the hosts of luminous radio AGN are quenched. At LAGN > 1023 W Hz−1, the fraction of radio AGN hosts that are quenched galaxies, fquenched, increases with LAGN from ∼50% to 100%, as shown in the upper panel. The uncertainty shown as the gray region is due to the LAGN limits. Δlog(SFR) shows no correlation with LAGN (Pearson correlation coefficient ρ ∼ −0.11).
Current usage metrics show cumulative count of Article Views (full-text article views including HTML views, PDF and ePub downloads, according to the available data) and Abstracts Views on Vision4Press platform.
Data correspond to usage on the plateform after 2015. The current usage metrics is available 48-96 hours after online publication and is updated daily on week days.
Initial download of the metrics may take a while.


