Fig. 5.
Download original image
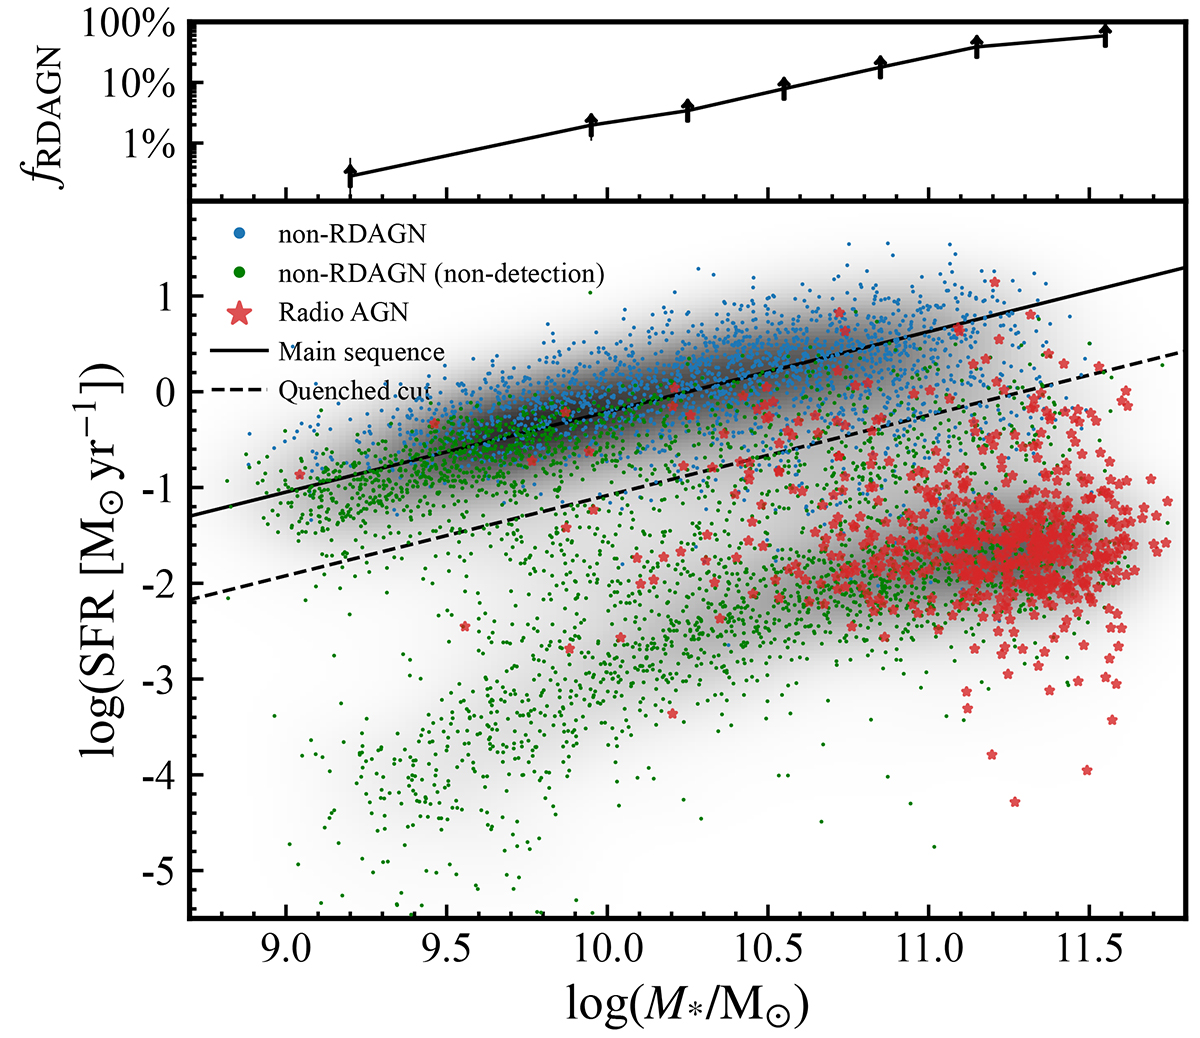
SFR vs stellar mass diagram for the LoTSS-MaNGA sample. The background grayscale density map shows the bimodal distribution of the star formation main sequence (SFMS) and the quenched population. Radio AGN are plotted as red stars while galaxies without confirmed radio excess (non-RDAGN) are plotted as blue (detection) and green (nondetection) dots. The black solid line is the SFMS. Galaxies below the 3σSFMS lower limit of the SFMS (black dashed line) are considered as quenched. Radio AGN host galaxies are dominated by massive and quenched populations. The upper panel shows the fraction of radio AGN in all quenched galaxies. The fraction increases with stellar mass to > 50% at the high-mass end (1011.5 M⊙).
Current usage metrics show cumulative count of Article Views (full-text article views including HTML views, PDF and ePub downloads, according to the available data) and Abstracts Views on Vision4Press platform.
Data correspond to usage on the plateform after 2015. The current usage metrics is available 48-96 hours after online publication and is updated daily on week days.
Initial download of the metrics may take a while.