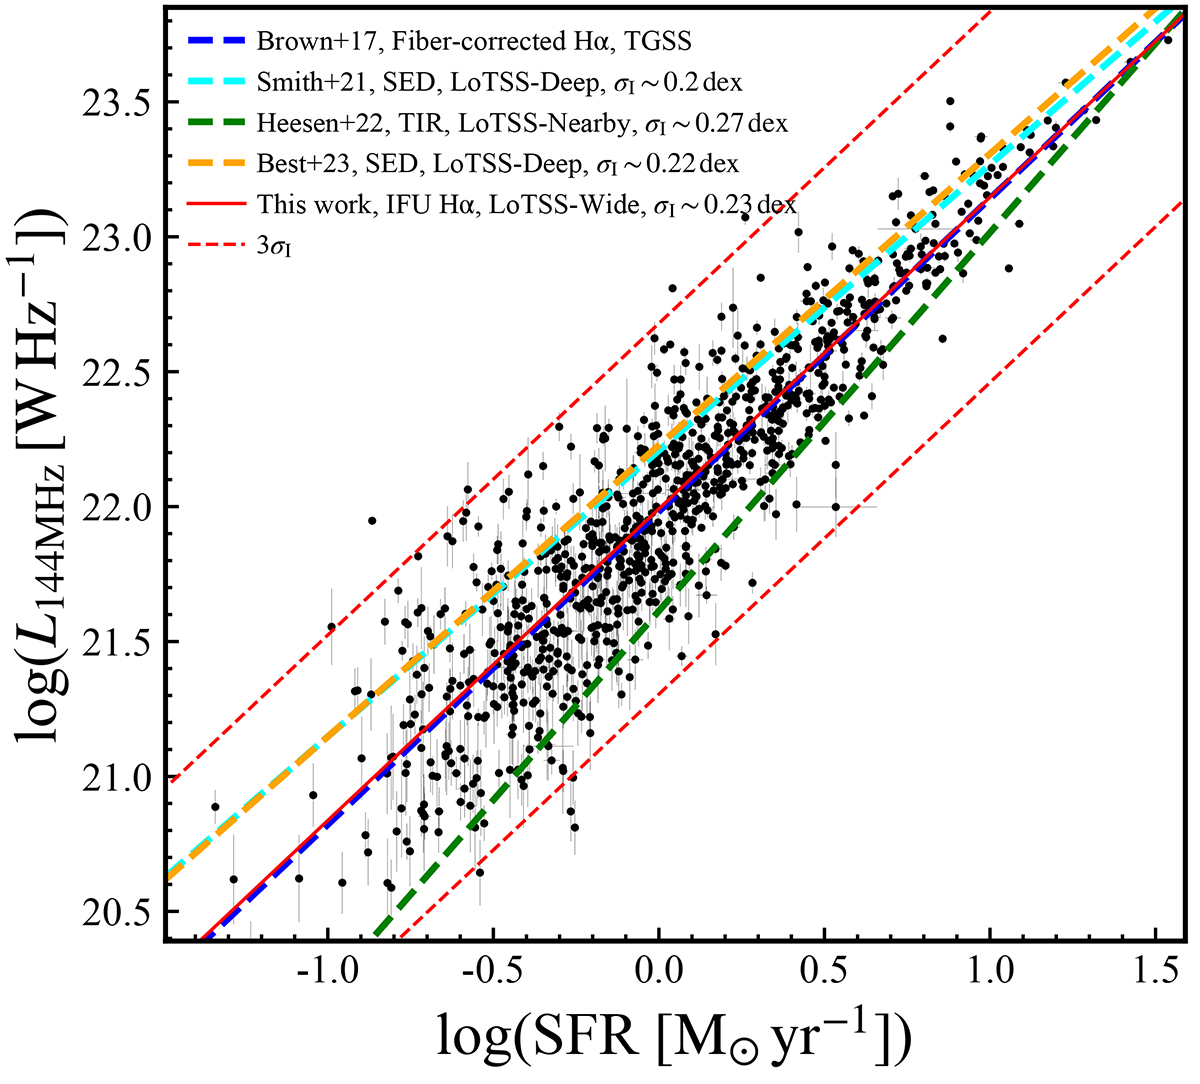
Fig. 2.
Download original image
Correlation between rest-frame 144 MHz luminosity and SFR. The black dots with errors are the pure star-forming galaxies used for linear fitting. These SFGs are selected based on optical line diagnostic and radio image visual classification (see Appendix A for details). The SFRs are integrated from MaNGA Hα maps and are corrected for dust attenuation as mentioned in Sect. 2.1. The red solid line is the MCMC linear fitting result. Intrinsic errors, ±3σI, are shown as red dashed lines. The blue, cyan, green, and orange dashed lines are the linear fitting results in Brown et al. (2017), Smith et al. (2021), Heesen et al. (2022), and Best et al. (2023), respectively. Our result is in good consistency with most literature results.
Current usage metrics show cumulative count of Article Views (full-text article views including HTML views, PDF and ePub downloads, according to the available data) and Abstracts Views on Vision4Press platform.
Data correspond to usage on the plateform after 2015. The current usage metrics is available 48-96 hours after online publication and is updated daily on week days.
Initial download of the metrics may take a while.