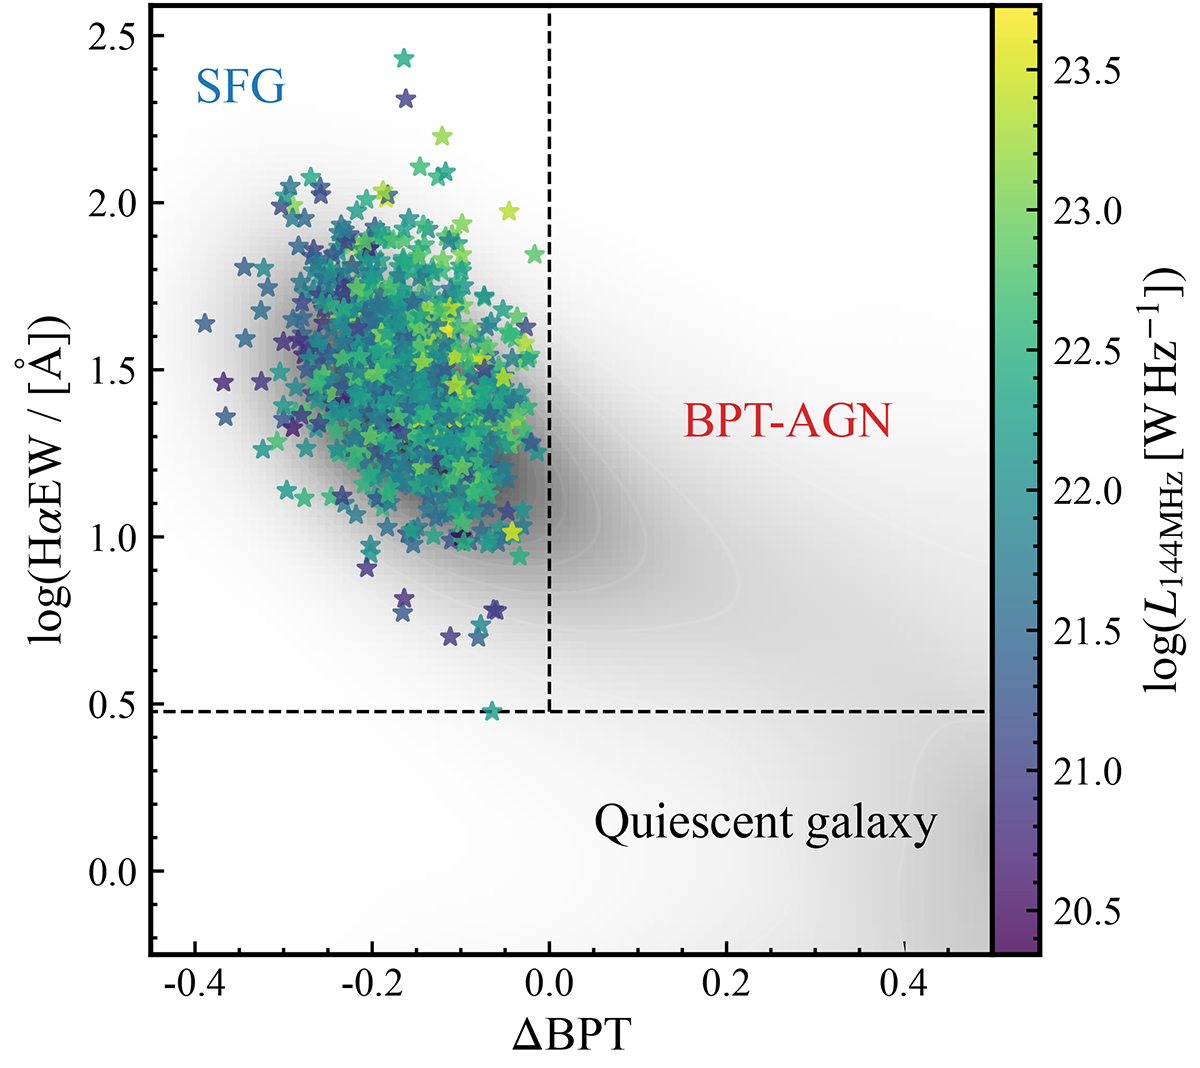
Fig. A.1.
Download original image
SFG sample selected by the emission line diagnostic and radio morphology. The y-axis is the equivalent width of Hα in the nuclear region measured from MaNGA spectra. The x-axis is the distance to the division line in the BPT diagram (Equation 1 in Kauffmann et al. 2003), based on the [N II]λ6585/Hα and [O III]λ5008/Hβ ratios. Negative and positive ΔBPT mean that galaxies locate in the star-forming region and AGN region in the BPT diagram, respectively. This Hα-ΔBPT diagram can classify the galaxies into SFG, AGN, and quiescent galaxies. Our pure SFG sample is plotted as stars and color-coded by their radio luminosities. The background grayscale contour is the distribution of the whole MaNGA sample.
Current usage metrics show cumulative count of Article Views (full-text article views including HTML views, PDF and ePub downloads, according to the available data) and Abstracts Views on Vision4Press platform.
Data correspond to usage on the plateform after 2015. The current usage metrics is available 48-96 hours after online publication and is updated daily on week days.
Initial download of the metrics may take a while.