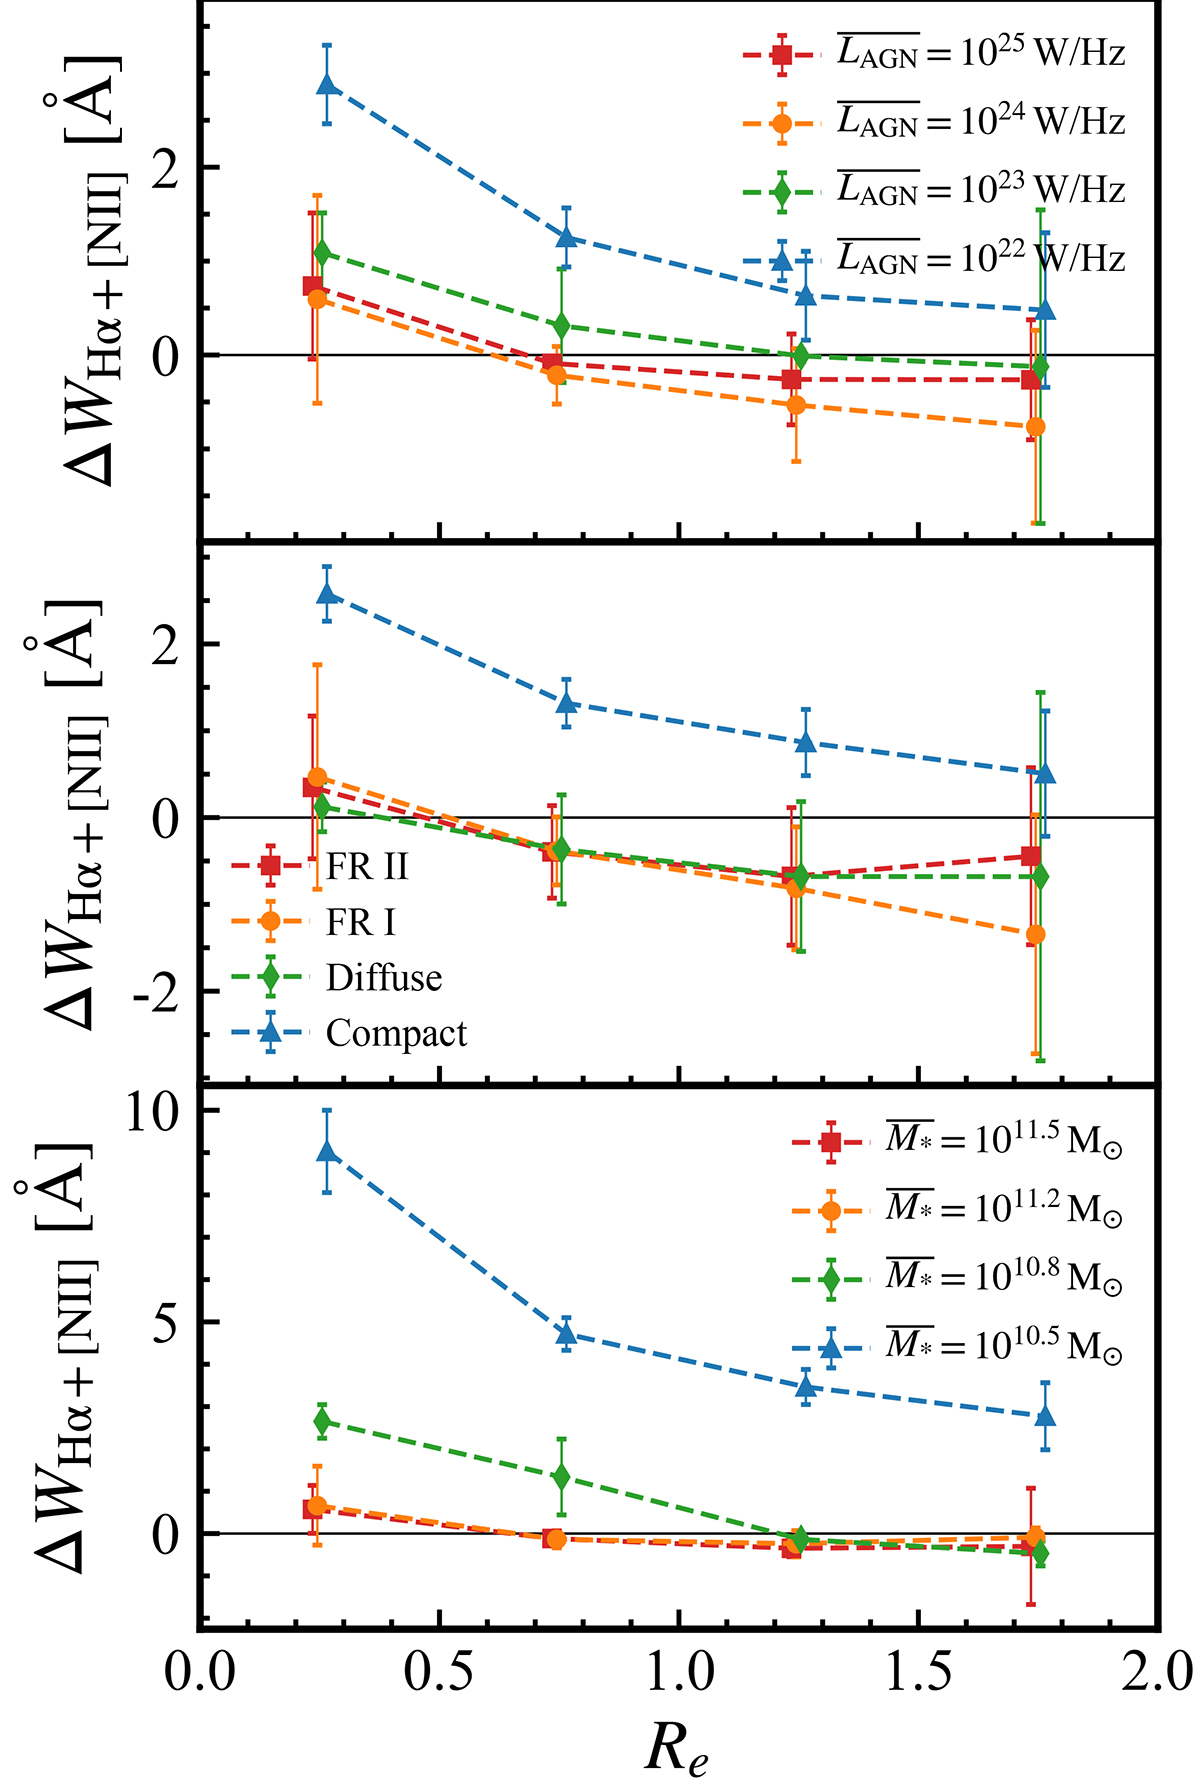
Fig. 12.
Download original image
Equivalent width radial profile and the 3σ error bars of the Hα + [N II] excess or deficiency (ΔWHα + [N II]) in different RDAGN subsamples. The panels from top to bottom show the results when dividing RDAGN by jet luminosity, radio morphology, and stellar mass, respectively. The profiles of the different subsamples are shown in different colors and markers. Positive ΔWHα + [N II] represents that RDAGN have stronger emission lines and vice versa. Low-luminosity (![]() W Hz−1), compact (< 6″), and lower mass RDAGN (
W Hz−1), compact (< 6″), and lower mass RDAGN (![]() ) contribute most to the nuclear excess. Weak emission line deficiencies are found in the outskirts of the large-size RDAGN population.
) contribute most to the nuclear excess. Weak emission line deficiencies are found in the outskirts of the large-size RDAGN population.
Current usage metrics show cumulative count of Article Views (full-text article views including HTML views, PDF and ePub downloads, according to the available data) and Abstracts Views on Vision4Press platform.
Data correspond to usage on the plateform after 2015. The current usage metrics is available 48-96 hours after online publication and is updated daily on week days.
Initial download of the metrics may take a while.