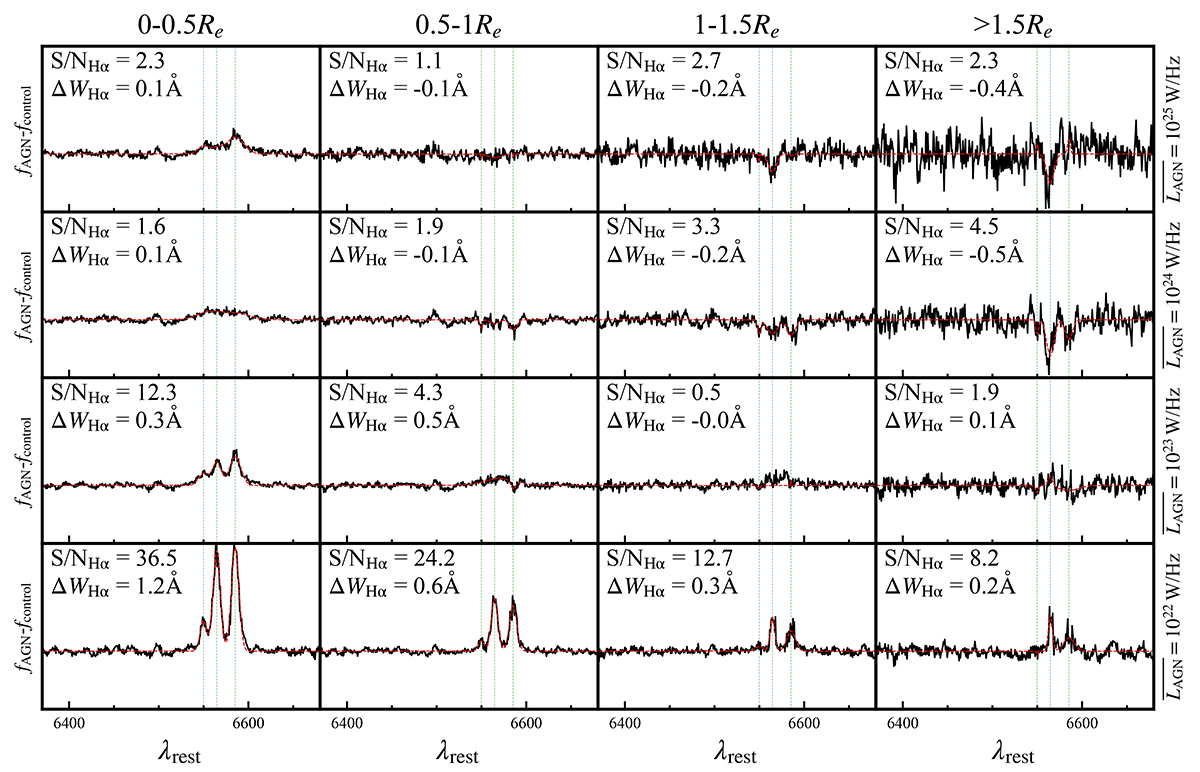
Fig. 11.
Download original image
Stacked differential spectra between RDAGN hosts and their controls in the [N II] doublets + Hα (green dashed lines) wavelength range. Stacking is done in subsamples with four LAGN bins (powerful to weak from top to bottom) and in four radial bins (center to outskirts from left to right). The red lines are the fitting results for the emission lines. During the fitting, we assume that the three emission lines have individual Gaussian profiles. The equivalent width of the Hα and its signal-to-noise ratio derived from the fitting results are listed in each panel. RDAGN hosts, especially the low-luminosity ones, have an emission line excess in their nuclear regions (leftmost panels). High LAGN RDAGN hosts show weak emission line deficiency in their outskirts (right panels).
Current usage metrics show cumulative count of Article Views (full-text article views including HTML views, PDF and ePub downloads, according to the available data) and Abstracts Views on Vision4Press platform.
Data correspond to usage on the plateform after 2015. The current usage metrics is available 48-96 hours after online publication and is updated daily on week days.
Initial download of the metrics may take a while.