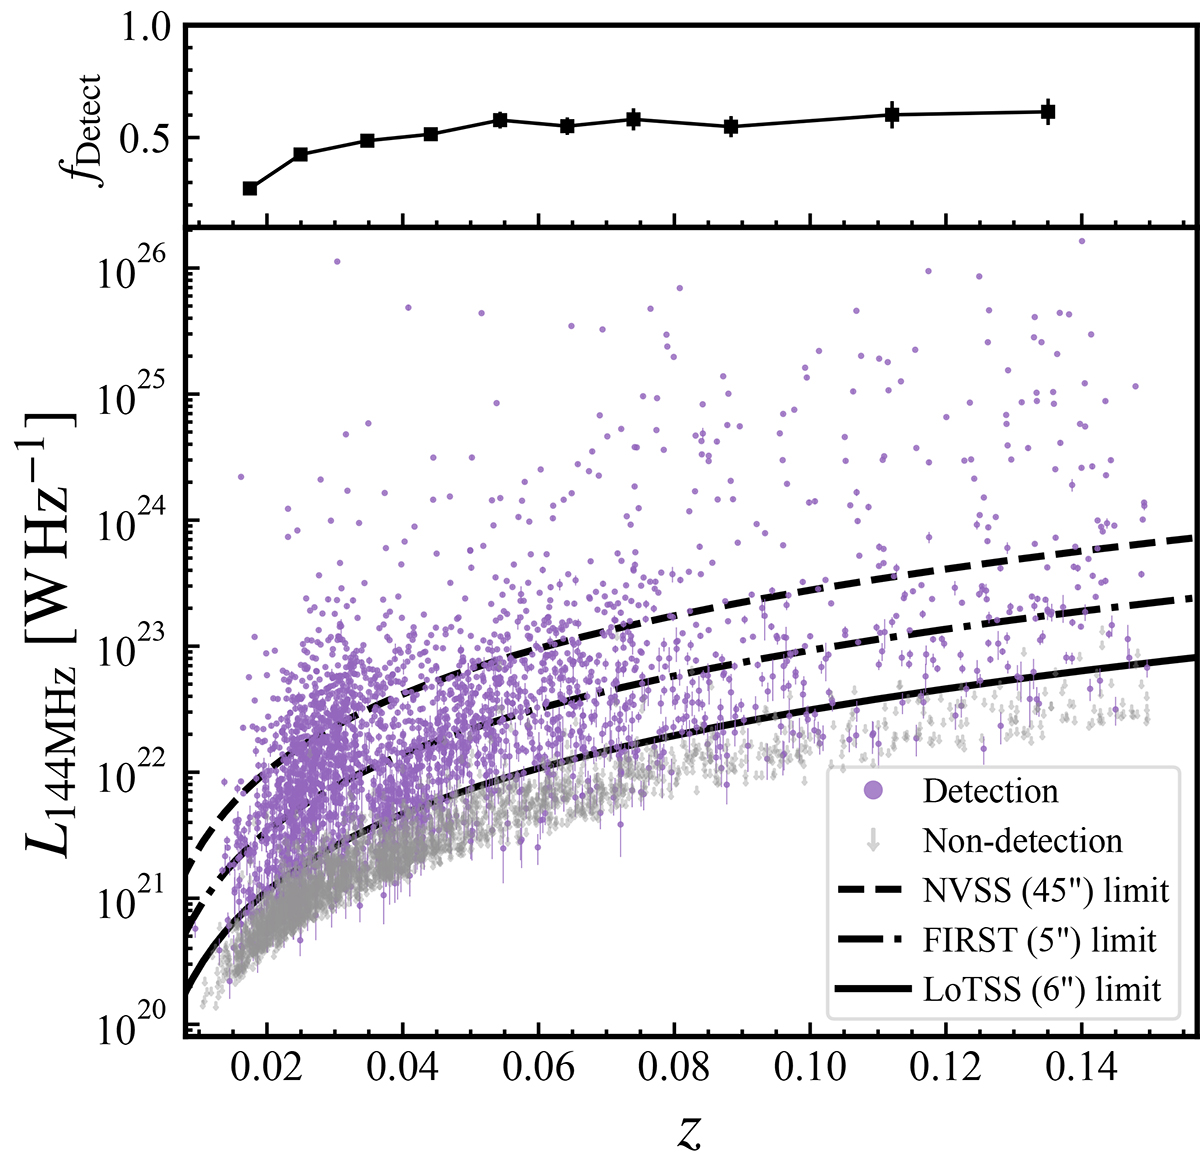
Fig. 1.
Download original image
Radio luminosity and upper limits of LoTSS-MaNGA sample vs their redshift. In the main panel the purple dots show radio luminosities with errors for the LoTSS detections. The gray arrows represent the upper limits of the radio luminosity for LoTSS nondetected galaxies. The solid, dash-dotted, and dashed lines represent the 90% completeness sensitivity limits of LoTSS (Shimwell et al. 2022), FIRST (Becker et al. 1995), and NVSS (Condon et al. 1998), respectively. We note that a few nondetections that are significantly above the LoTSS limit are the sources affected by nearby artifacts. The upper panel shows that the radio detection rate stays approximately constant with redshift, but decreases noticeably at z < 0.03, where the lower mass galaxies start to dominate the MaNGA sample.
Current usage metrics show cumulative count of Article Views (full-text article views including HTML views, PDF and ePub downloads, according to the available data) and Abstracts Views on Vision4Press platform.
Data correspond to usage on the plateform after 2015. The current usage metrics is available 48-96 hours after online publication and is updated daily on week days.
Initial download of the metrics may take a while.