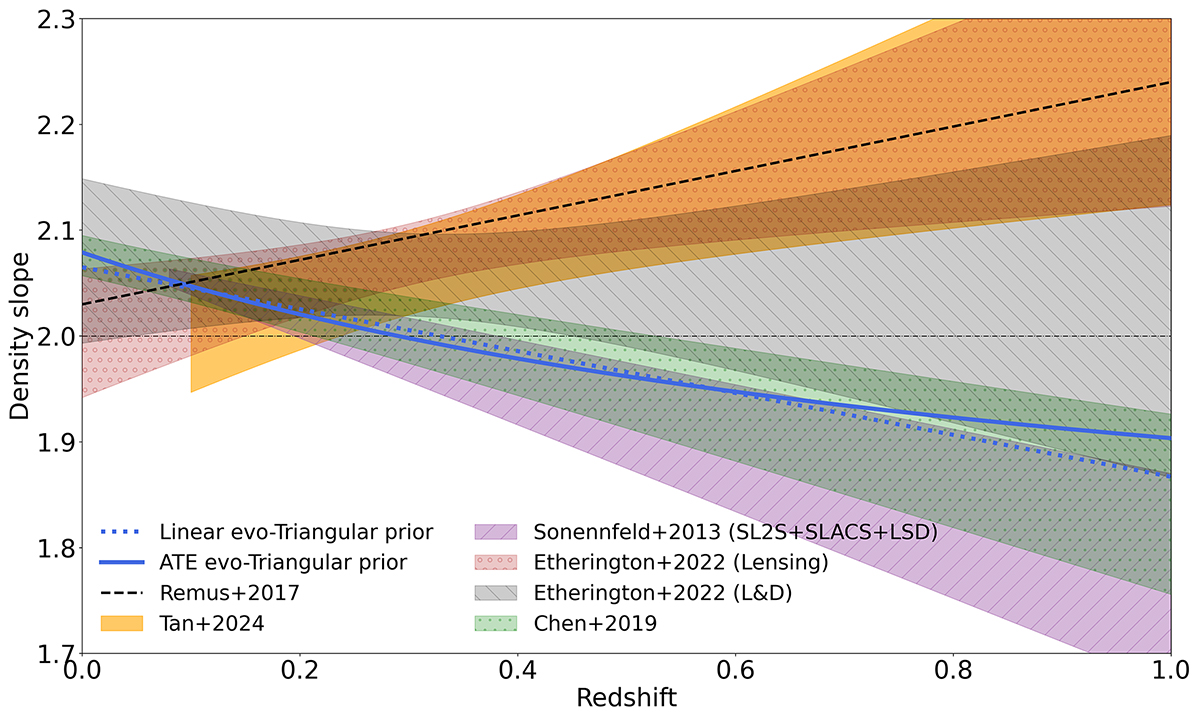
Fig. 16.
Download original image
Total density slope of early-type galaxies as a function of redshift. The dotted blue line represents the best fit using the linear evolution model with a triangular β prior, and the solid blue line represents the best fit using the ATE evolution model with the triangular prior described in Sect. 4.3.1. The dashed dark green line indicates the average total density slope from the Magneticum simulations (Remus et al. 2017). The light orange band shows the 1σ uncertainty region of constraints on elliptical galaxy mass profile evolution from Tan & Shajib (2024). The diagonal striped purple band represents the total density constraints based on lensing and dynamic information from the SL2S, SLACS, and LSD surveys. The circled red band shows the total density slope evolution constraints obtained by fitting the source light in every pixel of Hubble Space Telescope images from Etherington et al. (2023). The backward striped gray band indicates the lensing+dynamics constraints for overlapping systems with pixelized light-fitting constraints from Etherington et al. (2023). The dotted green band represents the single-density slope evolution constraints with the same sample as used in this paper from Chen et al. (2019).
Current usage metrics show cumulative count of Article Views (full-text article views including HTML views, PDF and ePub downloads, according to the available data) and Abstracts Views on Vision4Press platform.
Data correspond to usage on the plateform after 2015. The current usage metrics is available 48-96 hours after online publication and is updated daily on week days.
Initial download of the metrics may take a while.