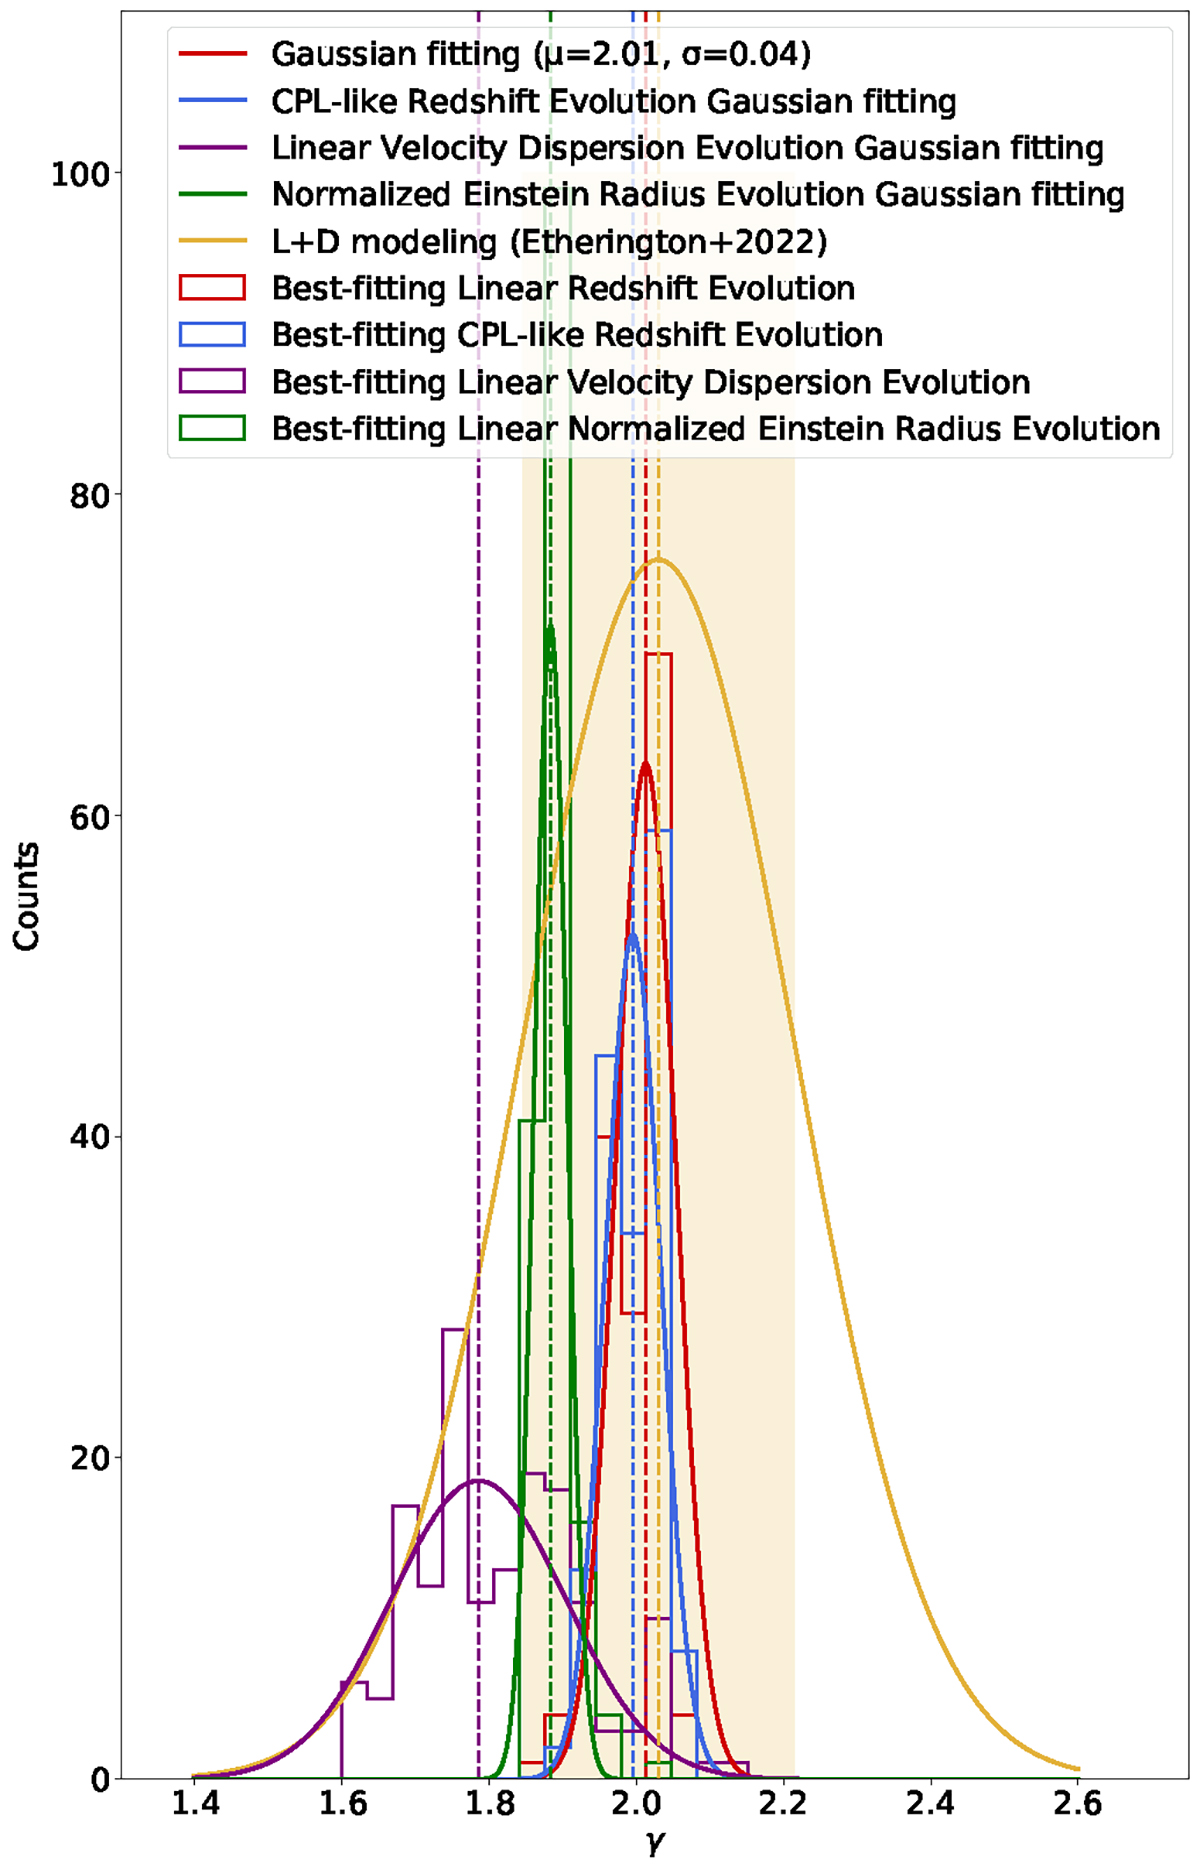
Fig. 15.
Download original image
Regenerated γ distributions from various evolutionary models. The red, blue, purple, and green steps represent the distributions from the best-fit linear redshift, ATE, linear velocity dispersion, and linear normalized Einstein radius evolution models, respectively. The solid yellow line indicates the γ distribution from lensing and dynamics modeling (Etherington et al. 2023), and the shaded area represents the 1σ uncertainty. The dashed lines in all colors mark the mean values from Gaussian fits of each distribution.
Current usage metrics show cumulative count of Article Views (full-text article views including HTML views, PDF and ePub downloads, according to the available data) and Abstracts Views on Vision4Press platform.
Data correspond to usage on the plateform after 2015. The current usage metrics is available 48-96 hours after online publication and is updated daily on week days.
Initial download of the metrics may take a while.