Open Access
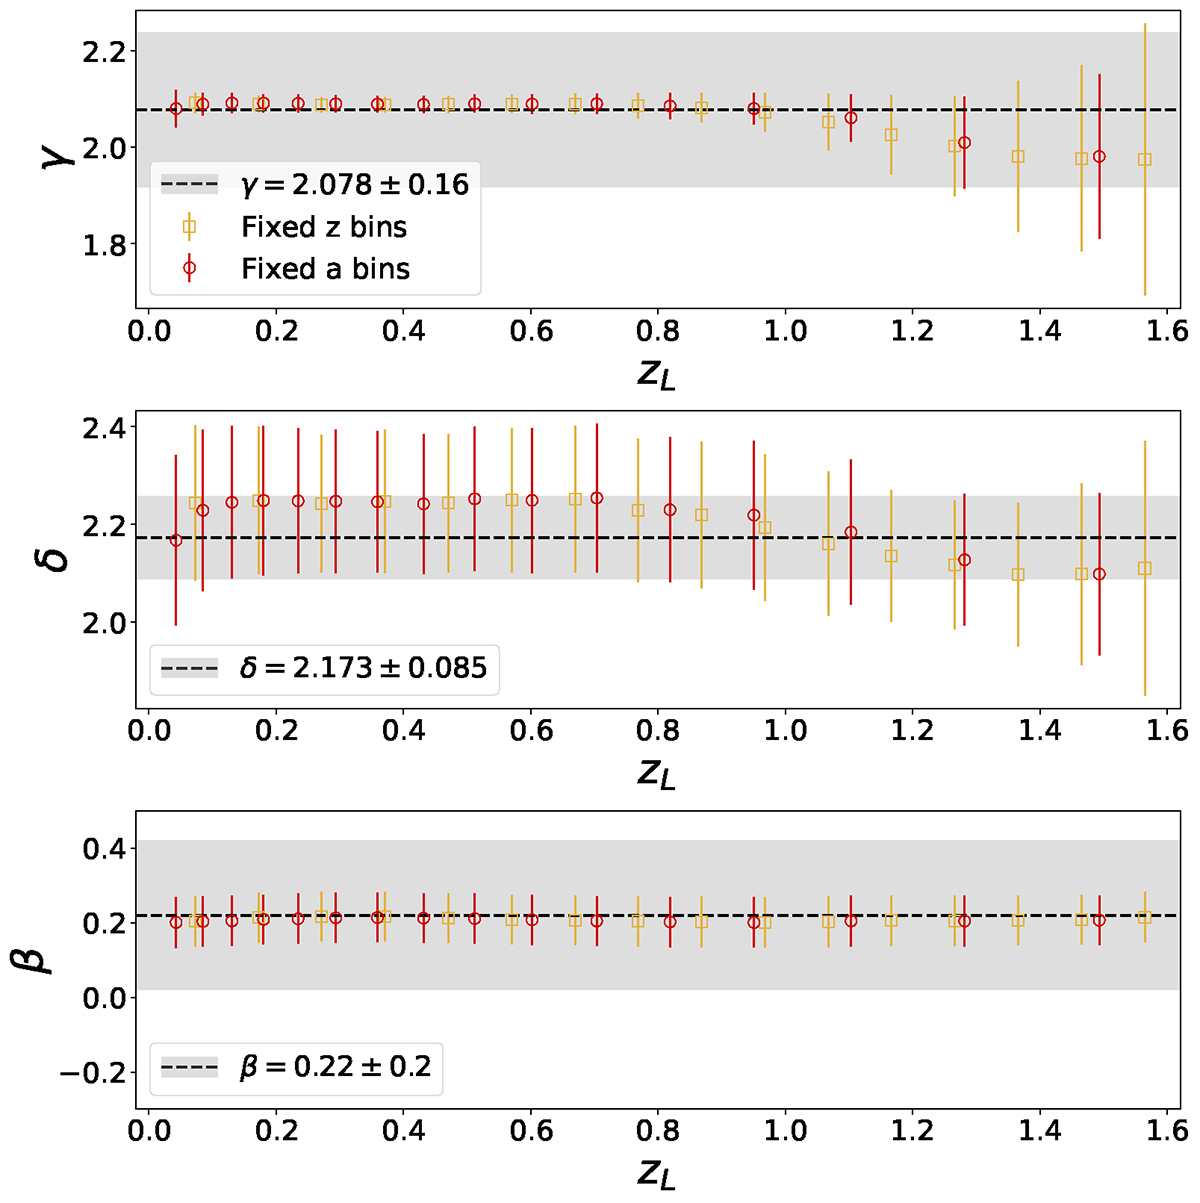
Fig. 12.
Download original image
Constraints on the density slope parameters for redshift bins (empty orange squares) and scale factor bins (empty red circles). The gray shaded regions represent the 1σ intervals for the fiducial density slope parameters for the simulation.
Current usage metrics show cumulative count of Article Views (full-text article views including HTML views, PDF and ePub downloads, according to the available data) and Abstracts Views on Vision4Press platform.
Data correspond to usage on the plateform after 2015. The current usage metrics is available 48-96 hours after online publication and is updated daily on week days.
Initial download of the metrics may take a while.