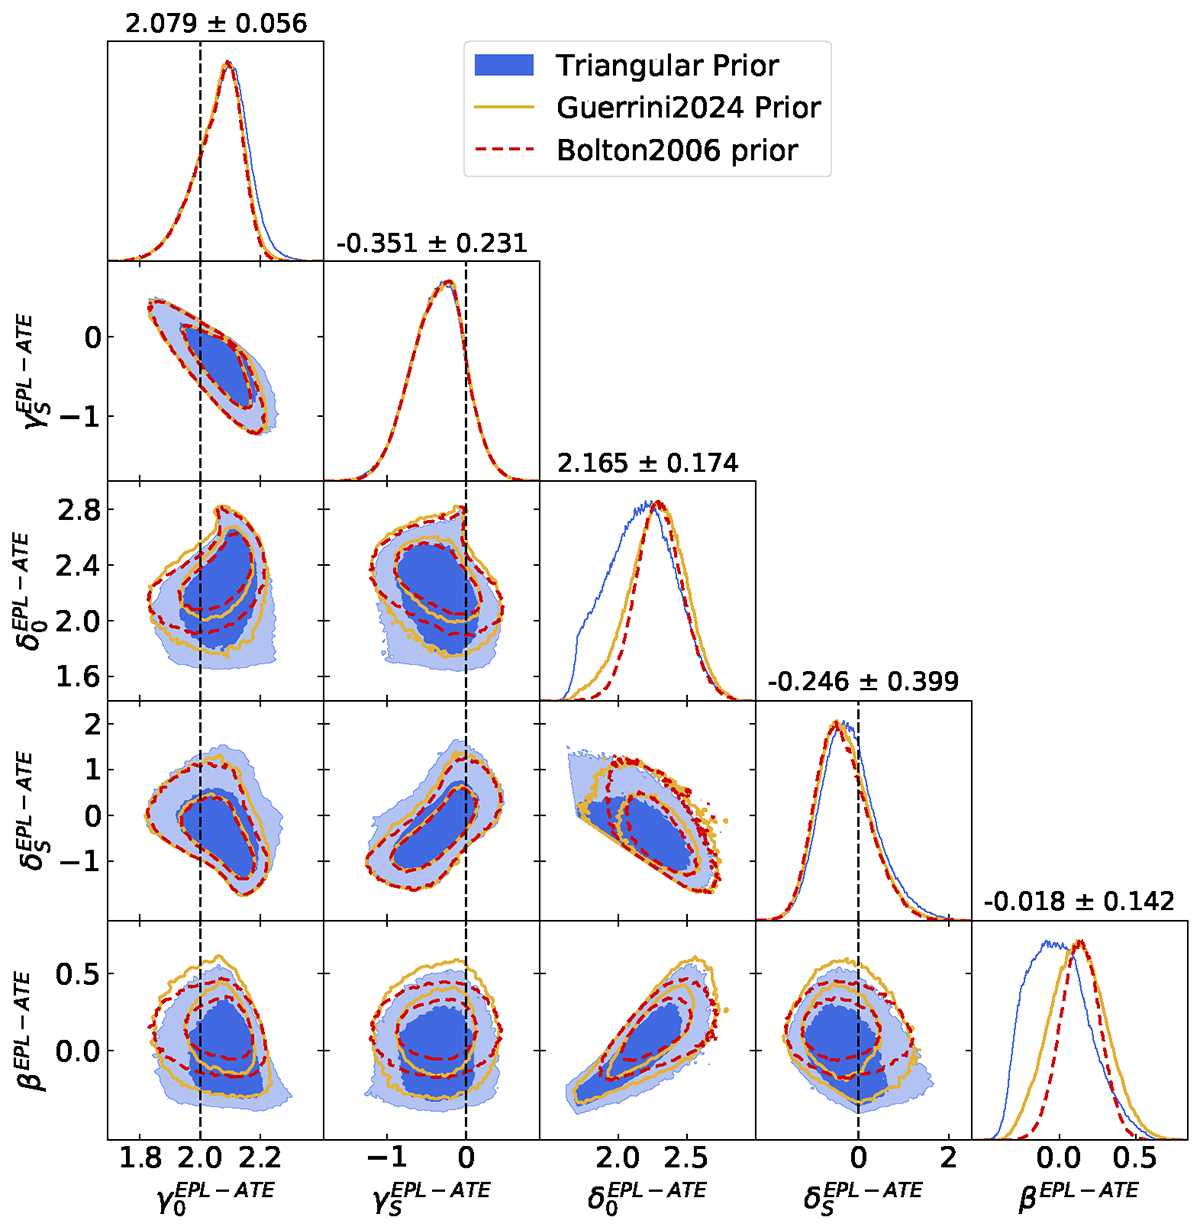
Fig. 10.
Download original image
Posterior distributions of the spherical power-law density model parameters under ATE evolution. The blue contours indicate the posterior distribution adopting the triangular prior of β (see Sect. 4.3.1). The yellow and red dashed contours represent the posterior distribution derived from Gaussian priors on β following Guerrini & Mörtsell (2024) and Bolton et al. (2006), respectively. The dashed black line corresponds to the case of the singular isothermal sphere.
Current usage metrics show cumulative count of Article Views (full-text article views including HTML views, PDF and ePub downloads, according to the available data) and Abstracts Views on Vision4Press platform.
Data correspond to usage on the plateform after 2015. The current usage metrics is available 48-96 hours after online publication and is updated daily on week days.
Initial download of the metrics may take a while.