Fig. 1.
Download original image
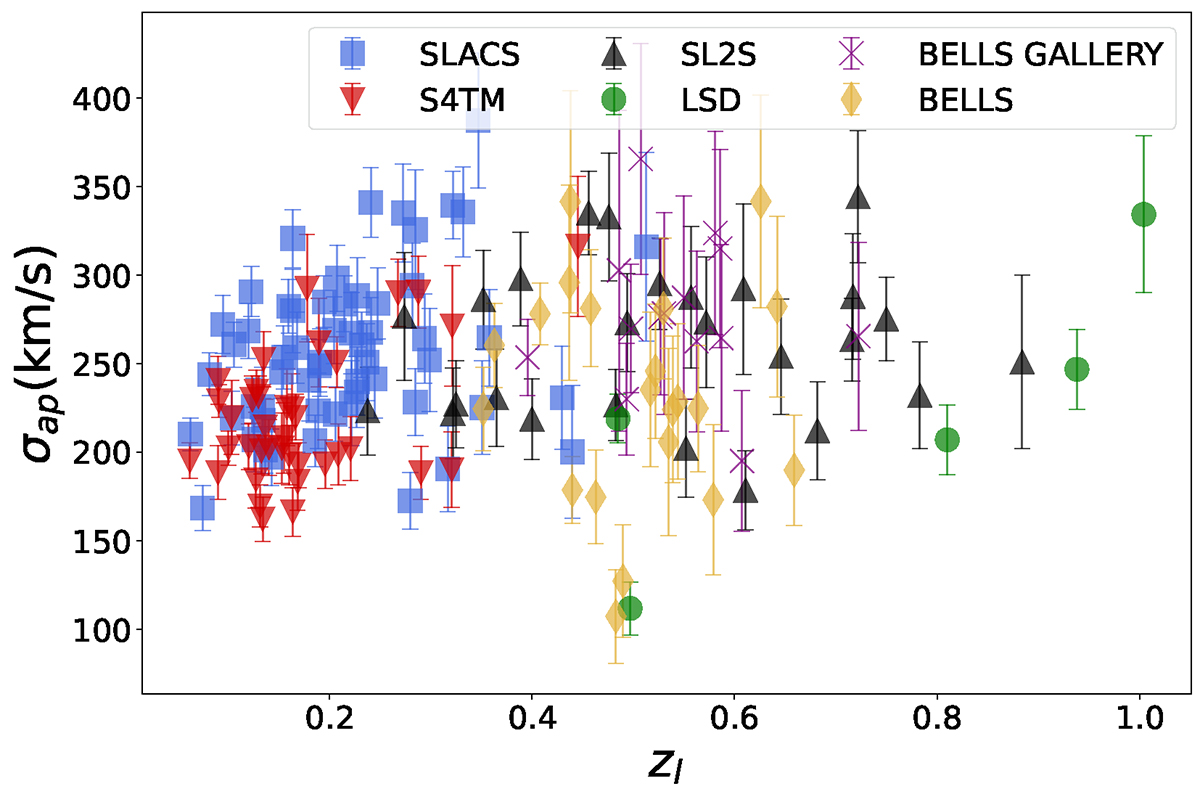
Distribution of the corrected velocity dispersions and redshifts for lensing galaxies in the combined sample from the various surveys. The blue squares represent lenses from SLACS, the green dots represent lenses from LSD, the red down triangles represent lenses from S4TM, the purple crosses represent lenses from BELLS GALLERY, the black triangles represent lenses from SL2S, and the yellow diamonds represent lenses from BELLS.
Current usage metrics show cumulative count of Article Views (full-text article views including HTML views, PDF and ePub downloads, according to the available data) and Abstracts Views on Vision4Press platform.
Data correspond to usage on the plateform after 2015. The current usage metrics is available 48-96 hours after online publication and is updated daily on week days.
Initial download of the metrics may take a while.