Fig. 9.
Download original image
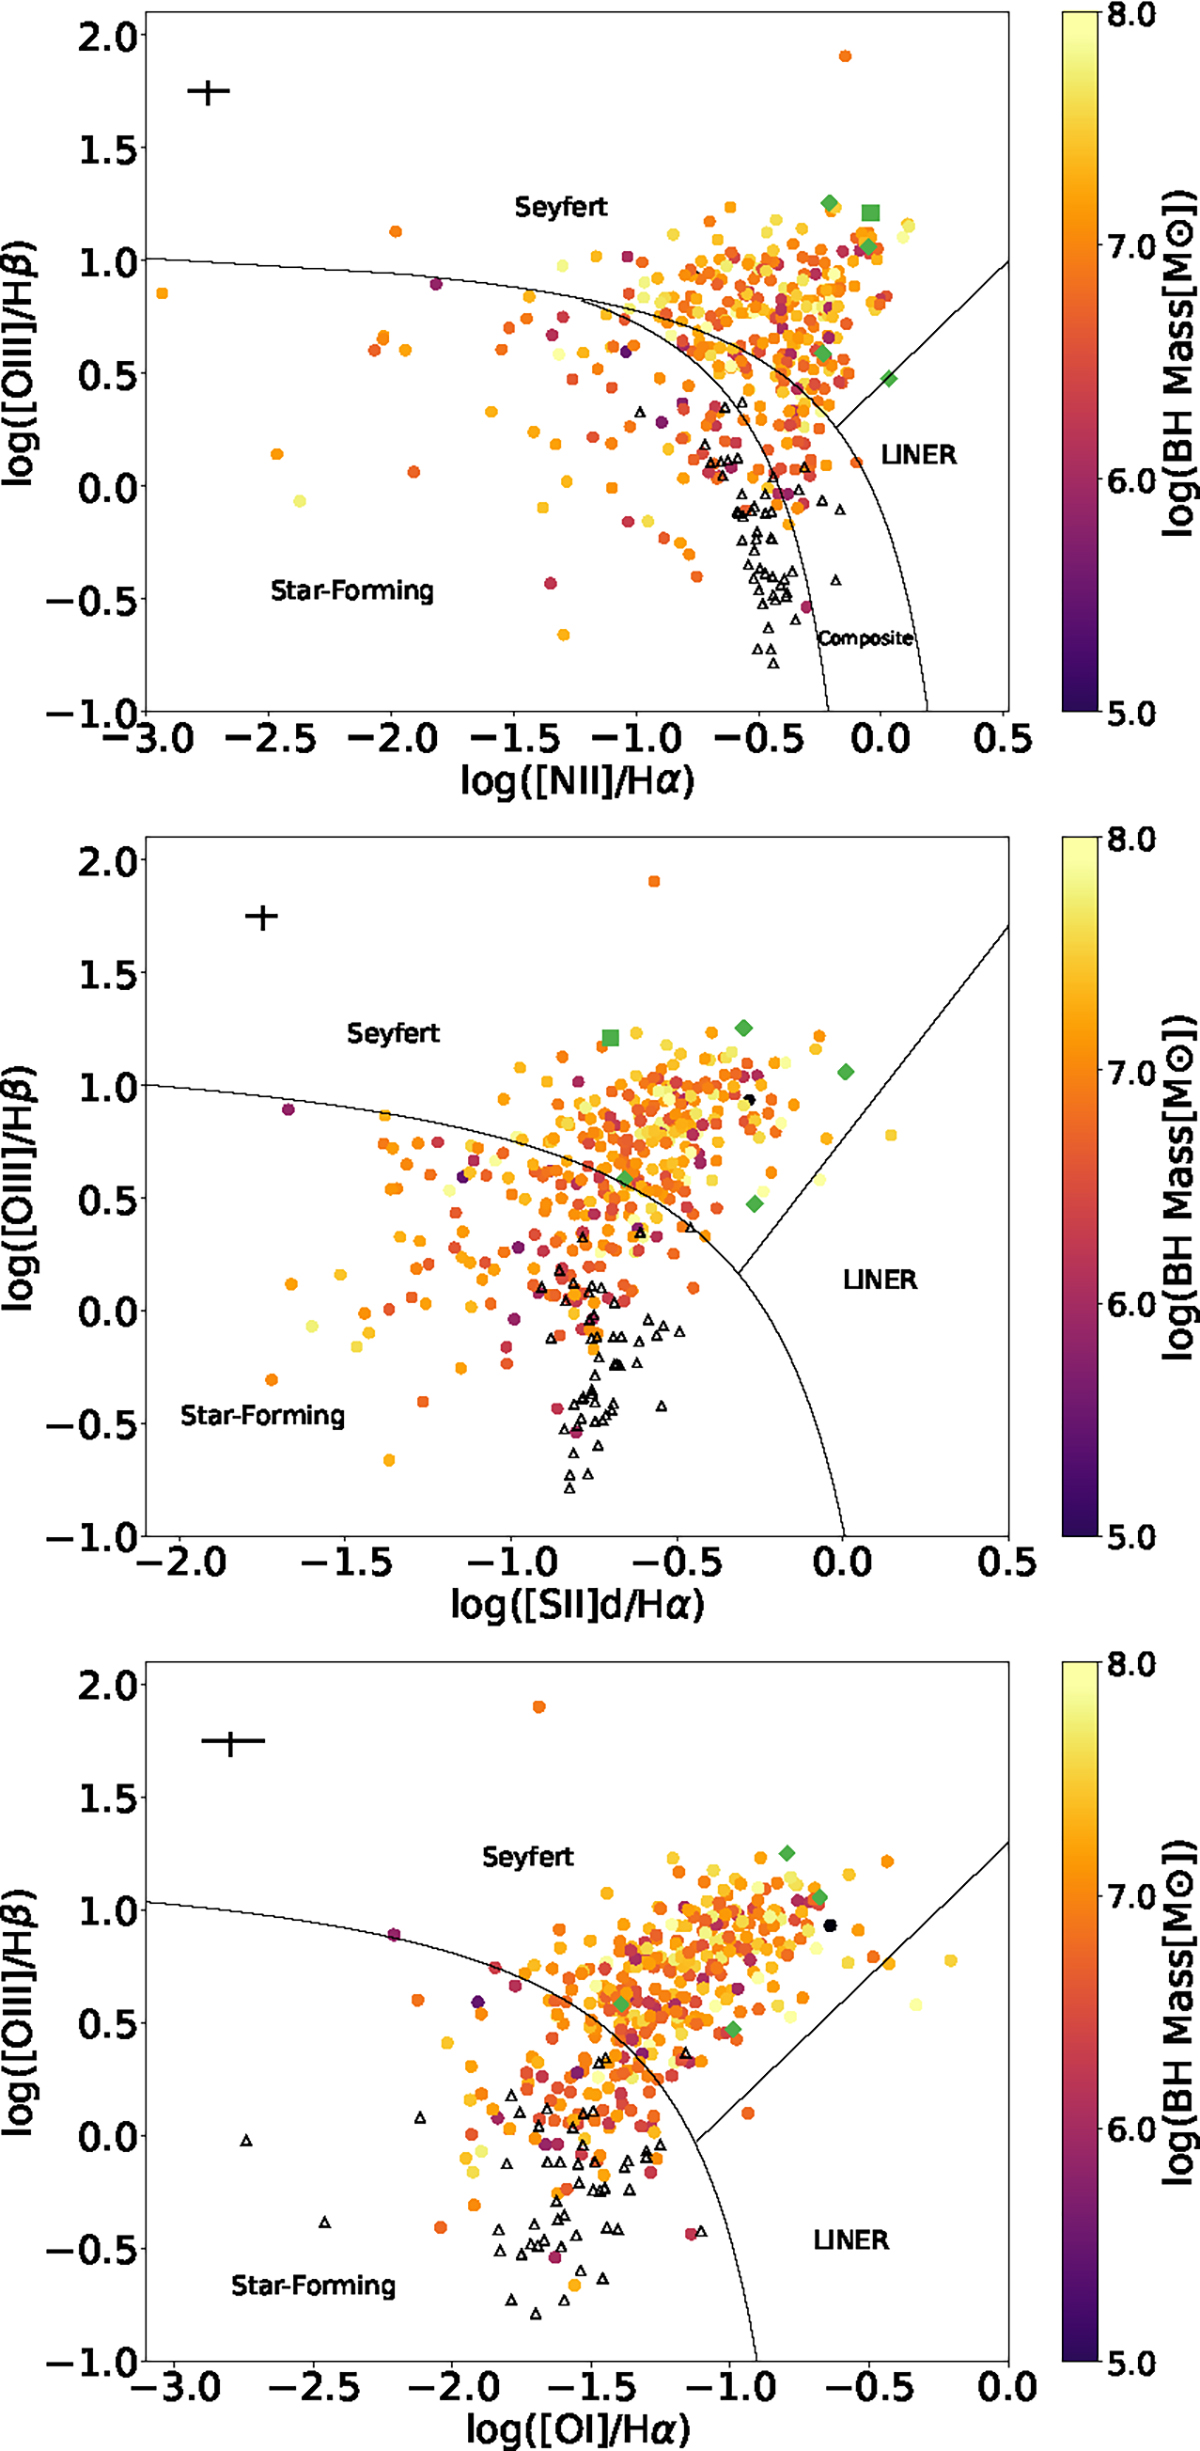
BPT diagrams from the measured flux of narrow emission lines. The color bar indicates the black hole mass on a logarithmic scale. The black triangles represent the objects with no mass estimation. In the top left corner, the black lines represent the mean errors. There are four objects classified as Seyfert (LINER) in all three BPT diagrams with no mass estimation (green diamonds). For these objects the WHAN classification is presented in Table 6. Furthermore, the object represented as a green square has an X-ray counterpart in the eRASSv1.1 catalog.
Current usage metrics show cumulative count of Article Views (full-text article views including HTML views, PDF and ePub downloads, according to the available data) and Abstracts Views on Vision4Press platform.
Data correspond to usage on the plateform after 2015. The current usage metrics is available 48-96 hours after online publication and is updated daily on week days.
Initial download of the metrics may take a while.