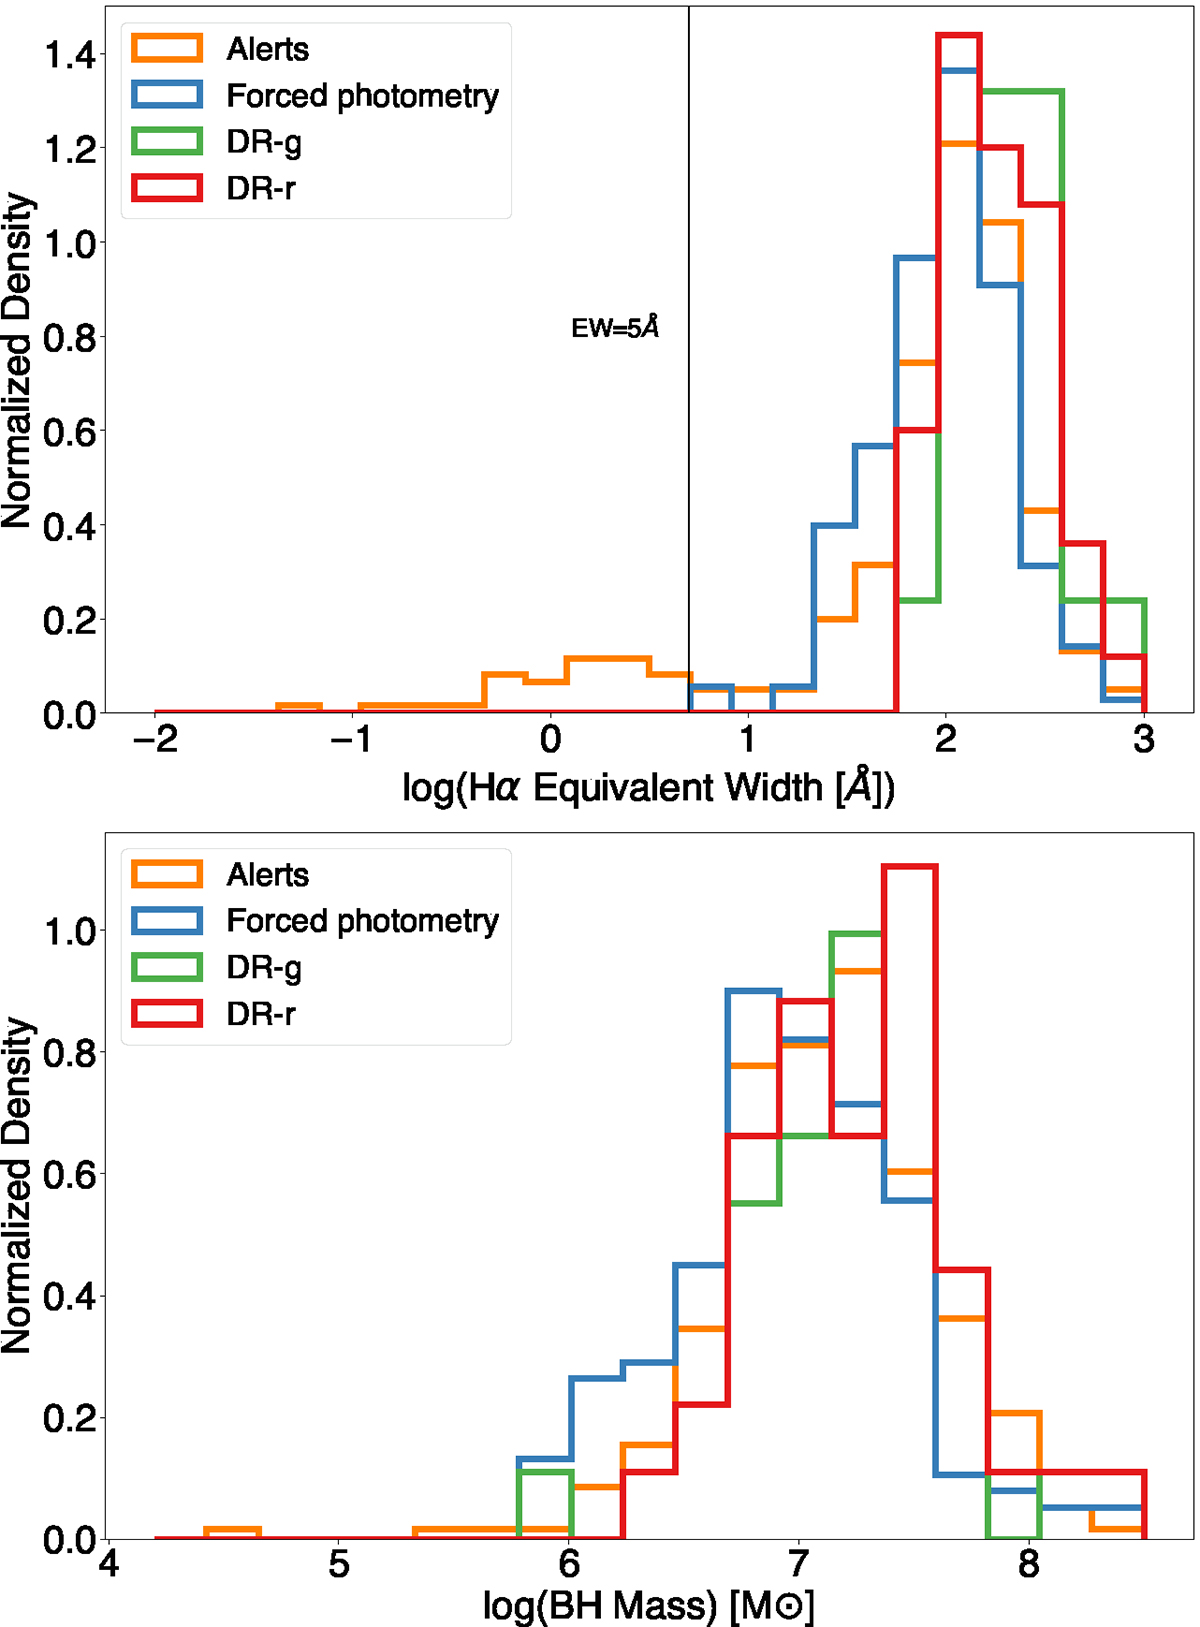
Fig. 7.
Download original image
Distribution of the equivalent width of the broad component of Hα (top) and of black hole masses derived using Eq. (1) (bottom) for objects with EWHα > 5 Å. In both histograms, each set of variability-selected AGN candidates is plotted in different colors: orange for Alerts, blue for Forced Photometry, green for ZTFDR11 g-band, and red for ZTFDR11 r-band. In the top panel, the vertical line indicates EWHα = 5 Å.
Current usage metrics show cumulative count of Article Views (full-text article views including HTML views, PDF and ePub downloads, according to the available data) and Abstracts Views on Vision4Press platform.
Data correspond to usage on the plateform after 2015. The current usage metrics is available 48-96 hours after online publication and is updated daily on week days.
Initial download of the metrics may take a while.