Fig. 4.
Download original image
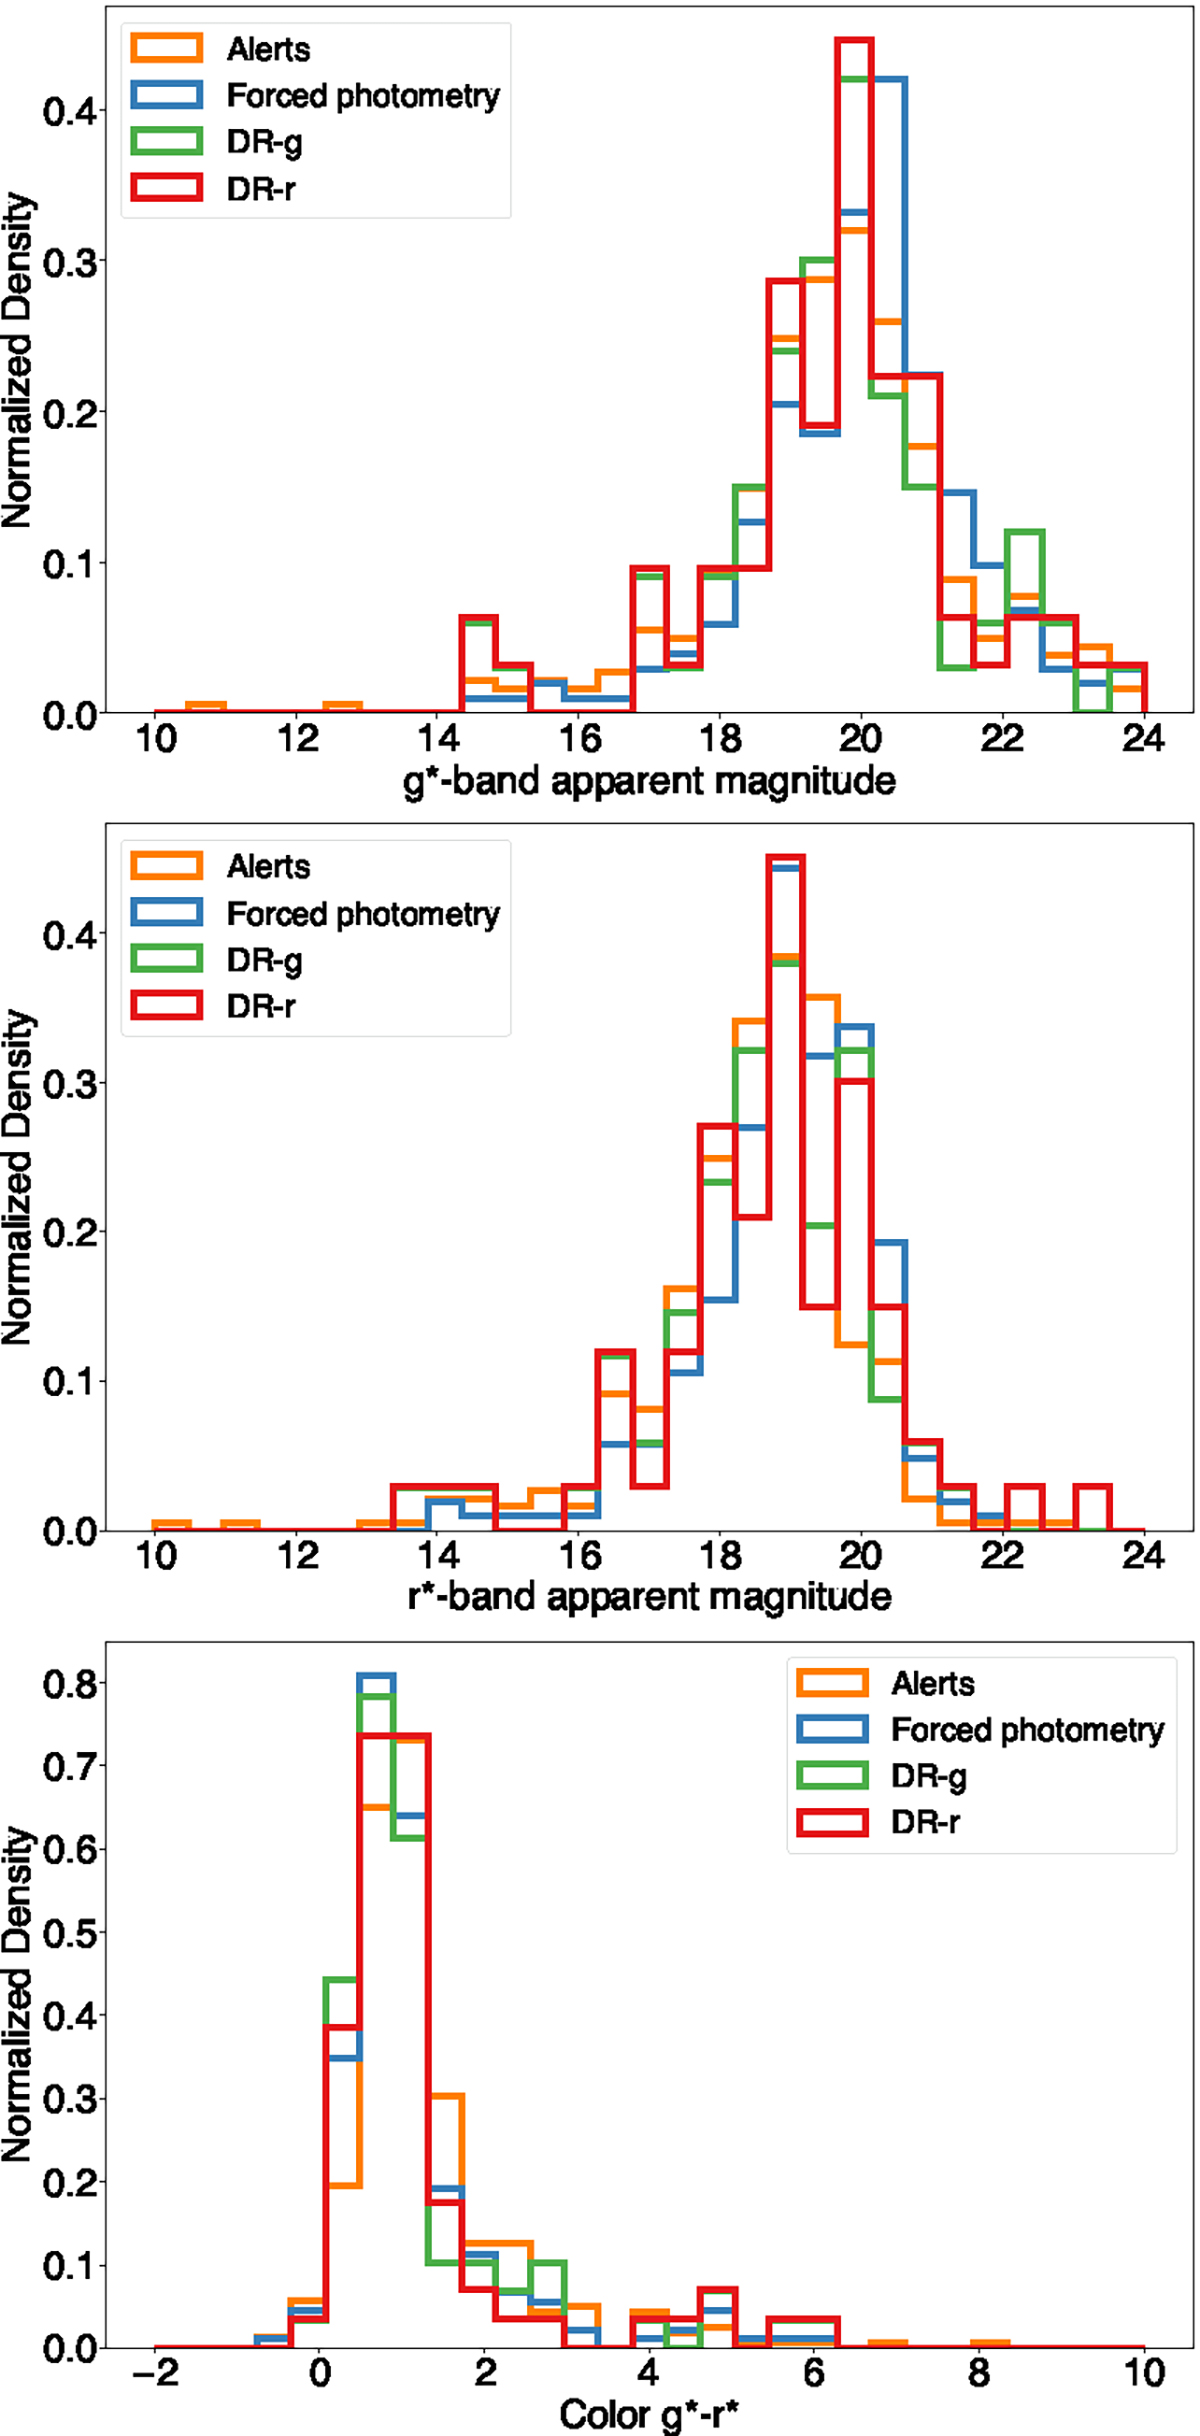
Apparent rest-frame magnitude distribution of AGN candidates in low stellar mass galaxies for the g* (top) and r* (middle) bands. The bottom panel shows the color g* − r* distributions. Each set of variability-selected AGN candidates is plotted in different colors: orange for Alerts, blue for Forced Photometry, green for ZTFDR11 g-band, and red for ZTFDR11 r-band.
Current usage metrics show cumulative count of Article Views (full-text article views including HTML views, PDF and ePub downloads, according to the available data) and Abstracts Views on Vision4Press platform.
Data correspond to usage on the plateform after 2015. The current usage metrics is available 48-96 hours after online publication and is updated daily on week days.
Initial download of the metrics may take a while.