Fig. 17.
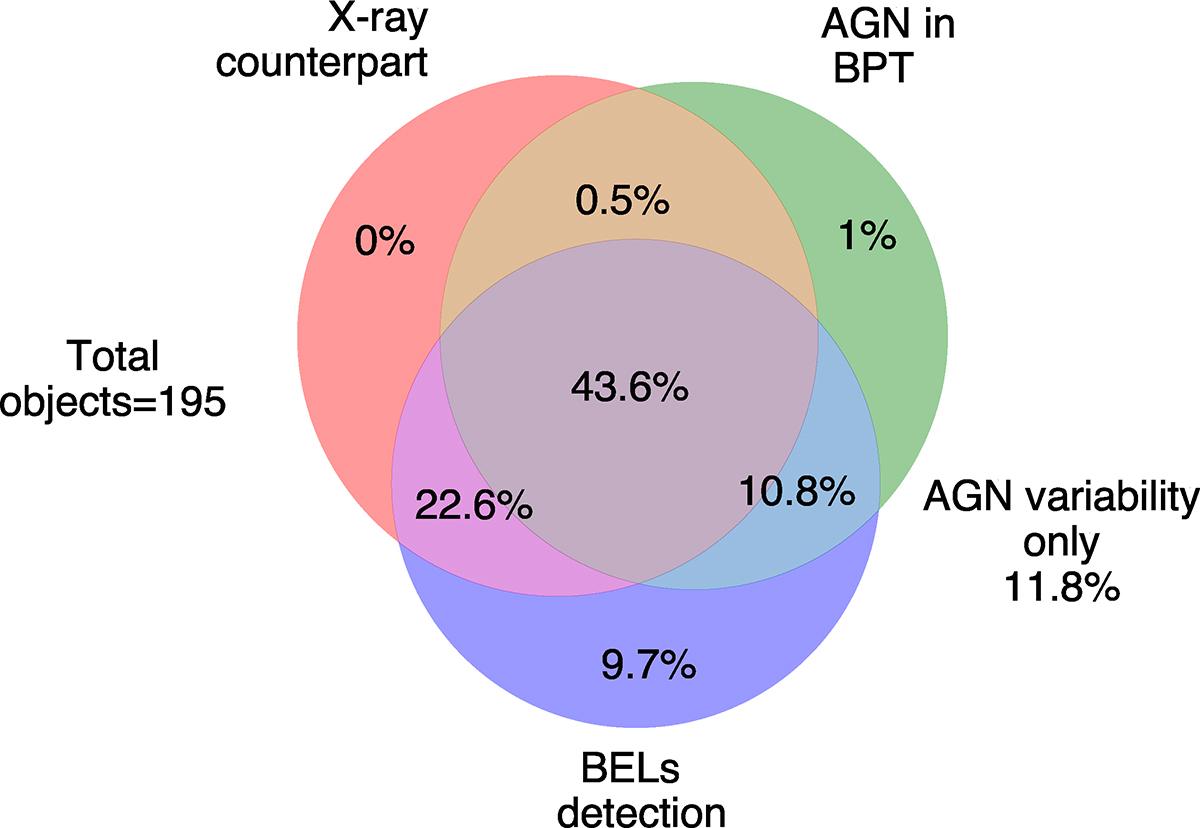
Download original image
Venn diagram of the 195 candidates that are in the VCS sample and that lie in the eROSITA-DE sky. The groups are objects with BEL detections (purple); objects classified as AGN (Seyfert or LINER) in at least two BPT diagrams (green); objects with X-ray counterparts (red); and the intersections. “AGN variability only” refers to the candidates in the eROSITA-DE sky falling outside the three mentioned groups.
Current usage metrics show cumulative count of Article Views (full-text article views including HTML views, PDF and ePub downloads, according to the available data) and Abstracts Views on Vision4Press platform.
Data correspond to usage on the plateform after 2015. The current usage metrics is available 48-96 hours after online publication and is updated daily on week days.
Initial download of the metrics may take a while.