Fig. 16.
Download original image
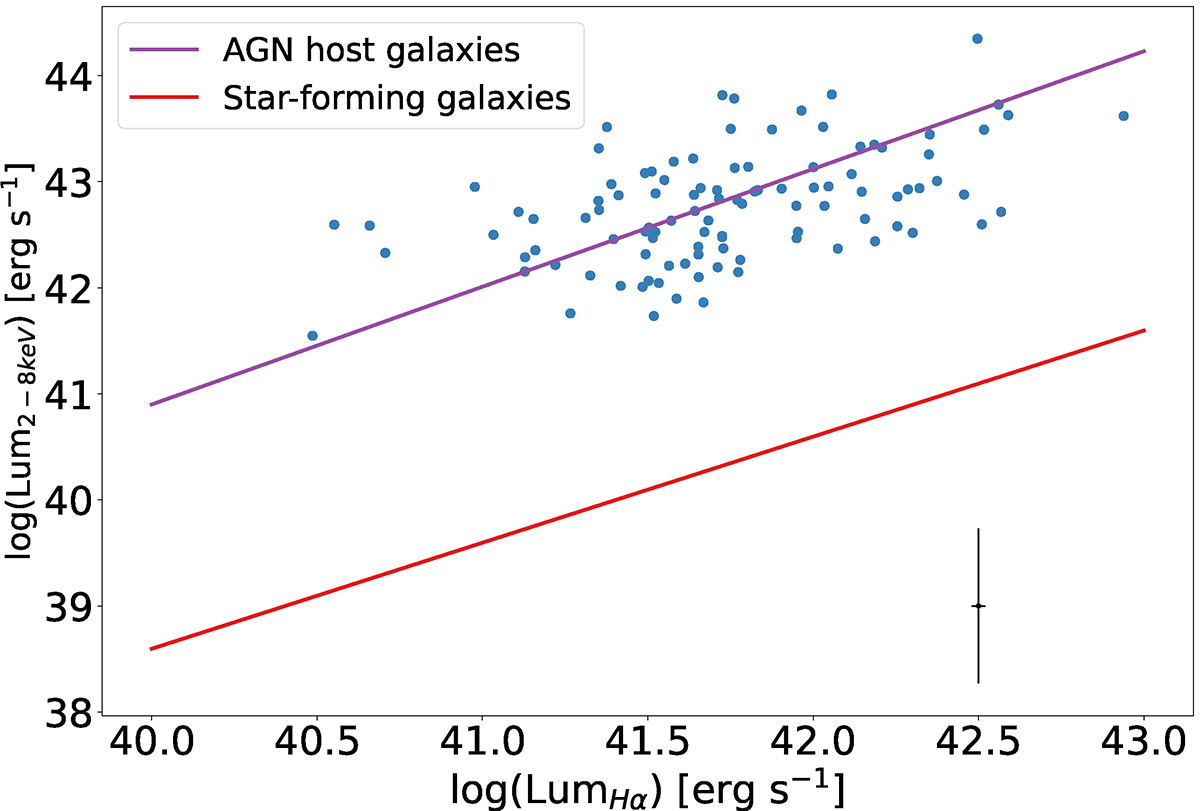
X-ray luminosity (2–8 keV band) and Hα (narrow+broad) luminosity comparison. The purple line plots the relation found by Ho et al. (2001) for AGN host galaxies, while the red line plots the relation for star-forming galaxies presented in Rosa González et al. (2009). The mean errors are shown in the bottom right with error bars.
Current usage metrics show cumulative count of Article Views (full-text article views including HTML views, PDF and ePub downloads, according to the available data) and Abstracts Views on Vision4Press platform.
Data correspond to usage on the plateform after 2015. The current usage metrics is available 48-96 hours after online publication and is updated daily on week days.
Initial download of the metrics may take a while.