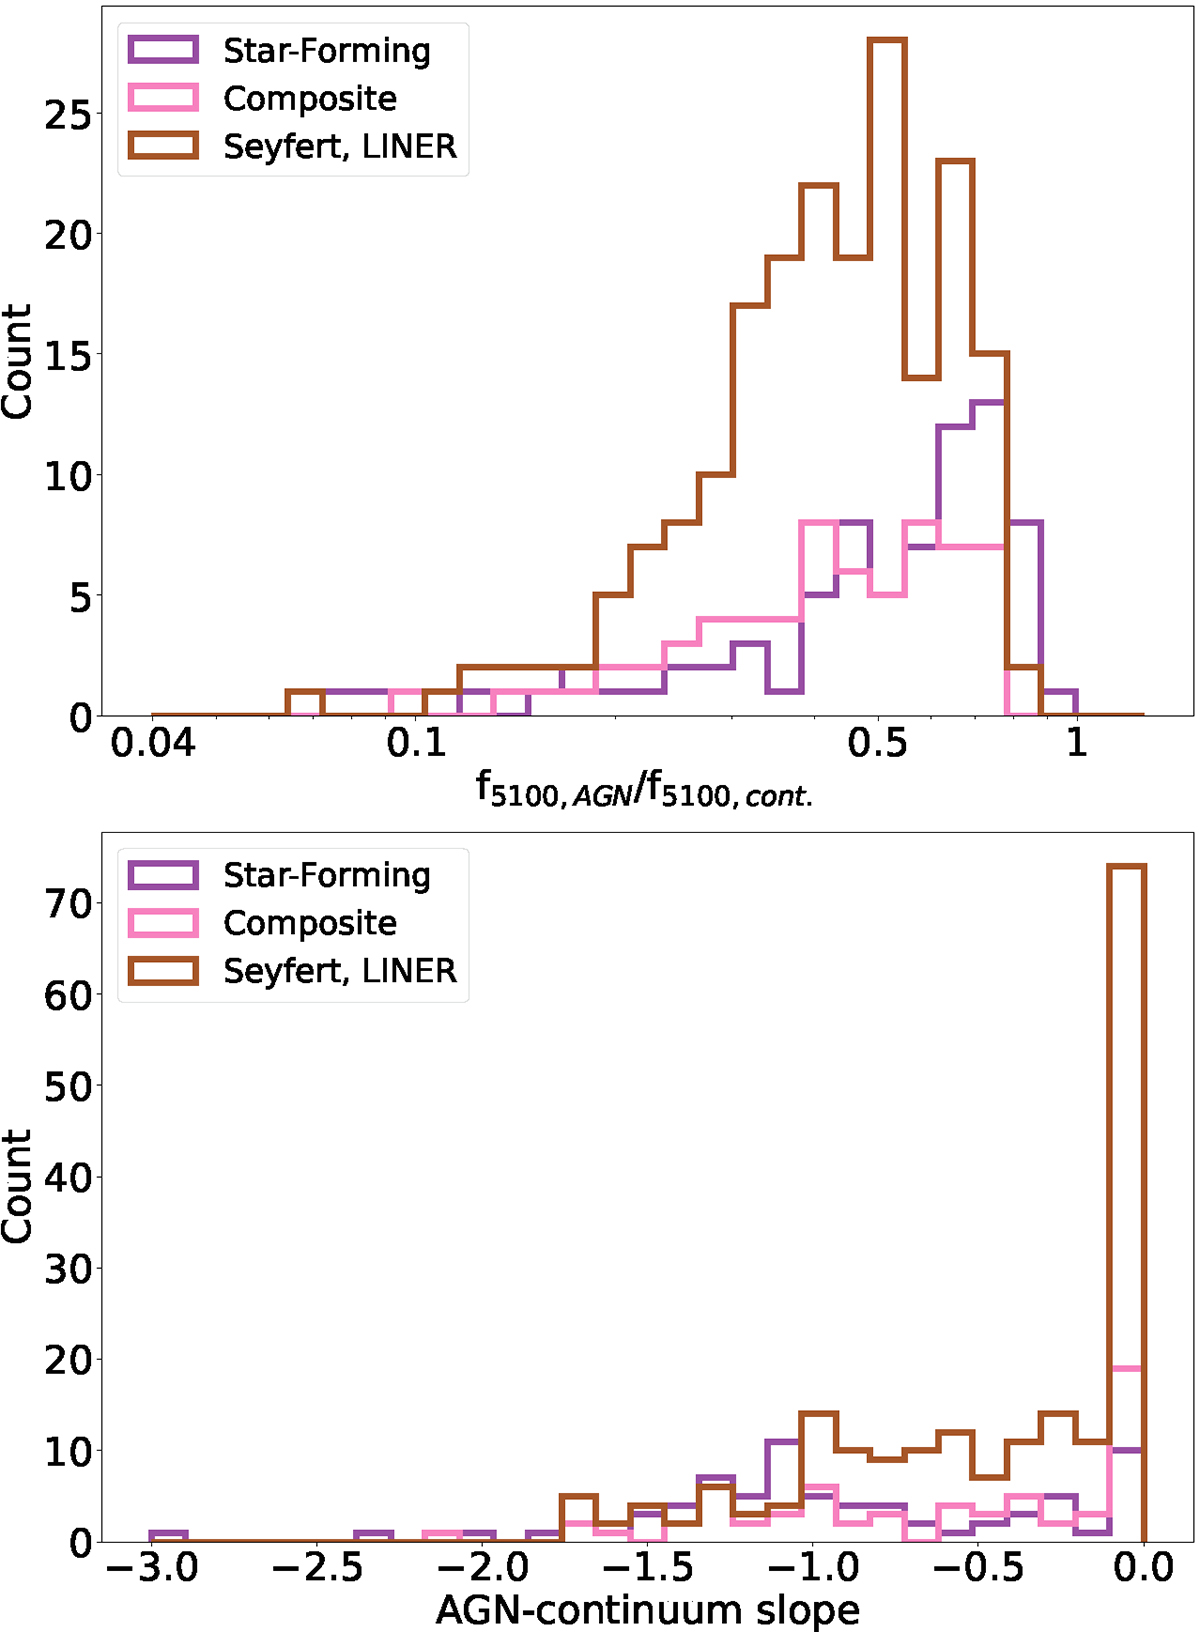
Fig. 12.
Download original image
Here we present the distribution of the AGN contribution to the continuum and the AGN-continuum slope for the different BPT classes. Top: distribution of the AGN relative contribution (f5100, AGN/f5100, cont.). For different BPT classes, according to the [OIII]/Hβ vs. [N II]/Hα diagram. The distributions for different classes, star-forming (purple), composite (pink), and Seyfert/LINER (brown) are similar to the Seyfert/LINER objects concentrated between 0.3 < f5100, AGN/f5100, cont. < 0.75. Bottom: Distribution of the fitted power slope for the same BPT classes.
Current usage metrics show cumulative count of Article Views (full-text article views including HTML views, PDF and ePub downloads, according to the available data) and Abstracts Views on Vision4Press platform.
Data correspond to usage on the plateform after 2015. The current usage metrics is available 48-96 hours after online publication and is updated daily on week days.
Initial download of the metrics may take a while.