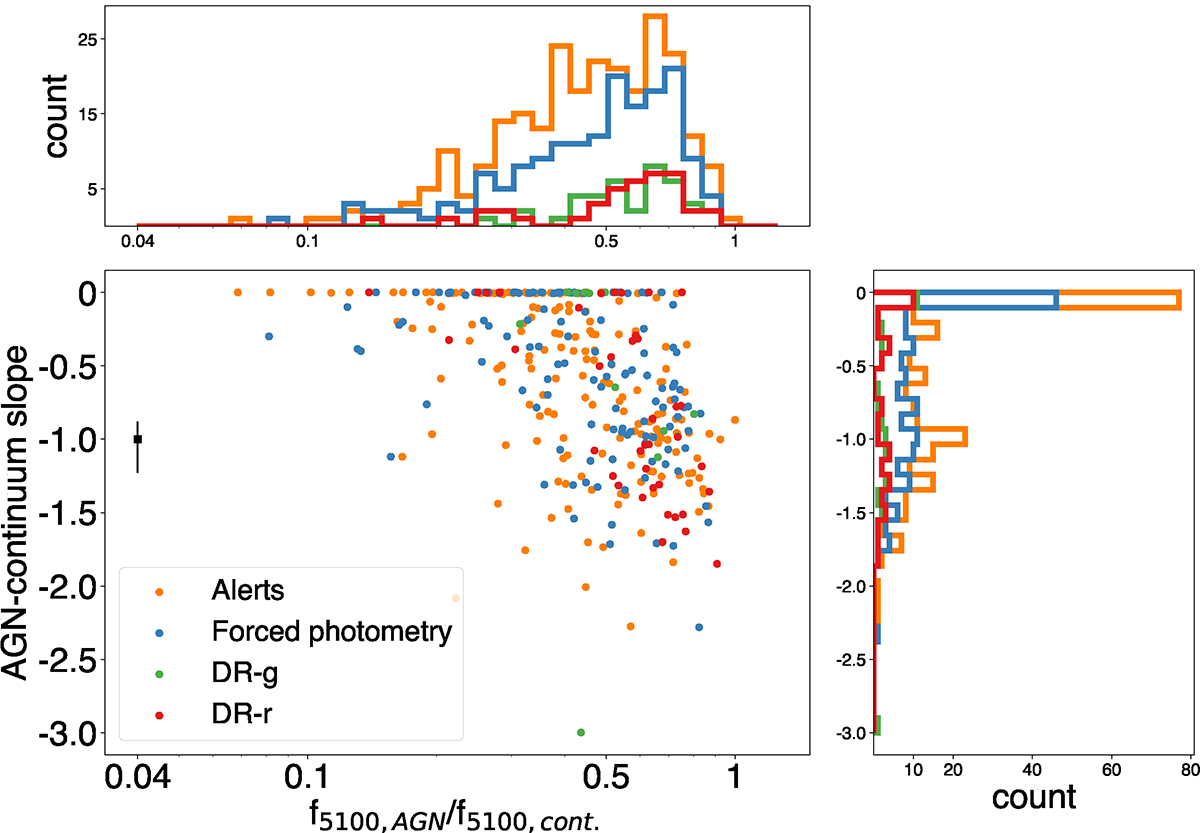
Fig. 11.
Download original image
Here we present the AGN-continuum slope and the AGN contribution to the continuum. Center: comparison of the AGN-continuum slope from the best fit with the ratio of the AGN component and total continuum at 5100 Å. The different colors represent the different sets: orange for Alerts, blue for Forced Photometry, green for DR-g, and red for DR-r. The black square and error bars represent the typical error in the AGN-continuum slope constrained by the 16th and 84th percentile values from the simulations. In the top panel, the distribution of the AGN relative contribution (f5100, AGN/f5100, cont.) is plotted for each set. Additionally, in the right panel, the power-law slope (γ) distribution of each set is shown.
Current usage metrics show cumulative count of Article Views (full-text article views including HTML views, PDF and ePub downloads, according to the available data) and Abstracts Views on Vision4Press platform.
Data correspond to usage on the plateform after 2015. The current usage metrics is available 48-96 hours after online publication and is updated daily on week days.
Initial download of the metrics may take a while.