Open Access
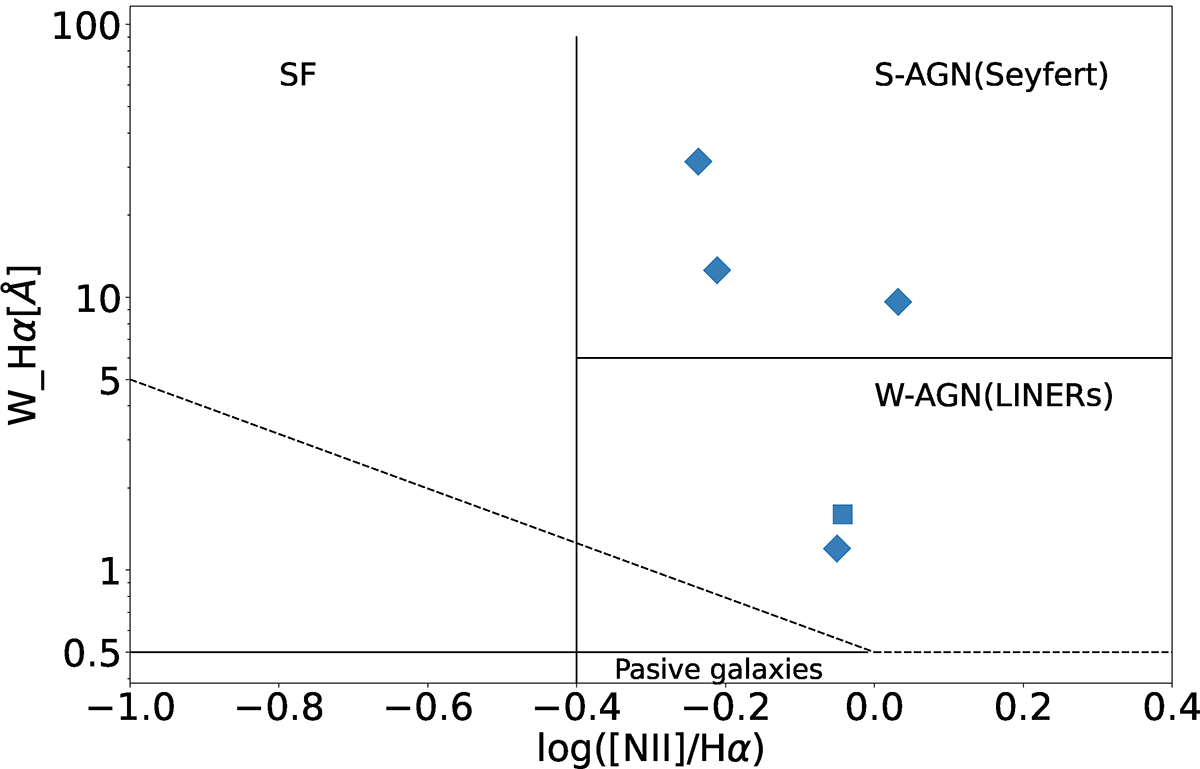
Fig. 10.
Download original image
WHAN diagram for the five objects resulting in the AGN region on BPT diagrams, but showing no BELs. The blue markers show the position of these objects in the diagram. Three of them fall in the S-AGN region and two in the W-AGN region.
Current usage metrics show cumulative count of Article Views (full-text article views including HTML views, PDF and ePub downloads, according to the available data) and Abstracts Views on Vision4Press platform.
Data correspond to usage on the plateform after 2015. The current usage metrics is available 48-96 hours after online publication and is updated daily on week days.
Initial download of the metrics may take a while.