Fig. 6
Download original image
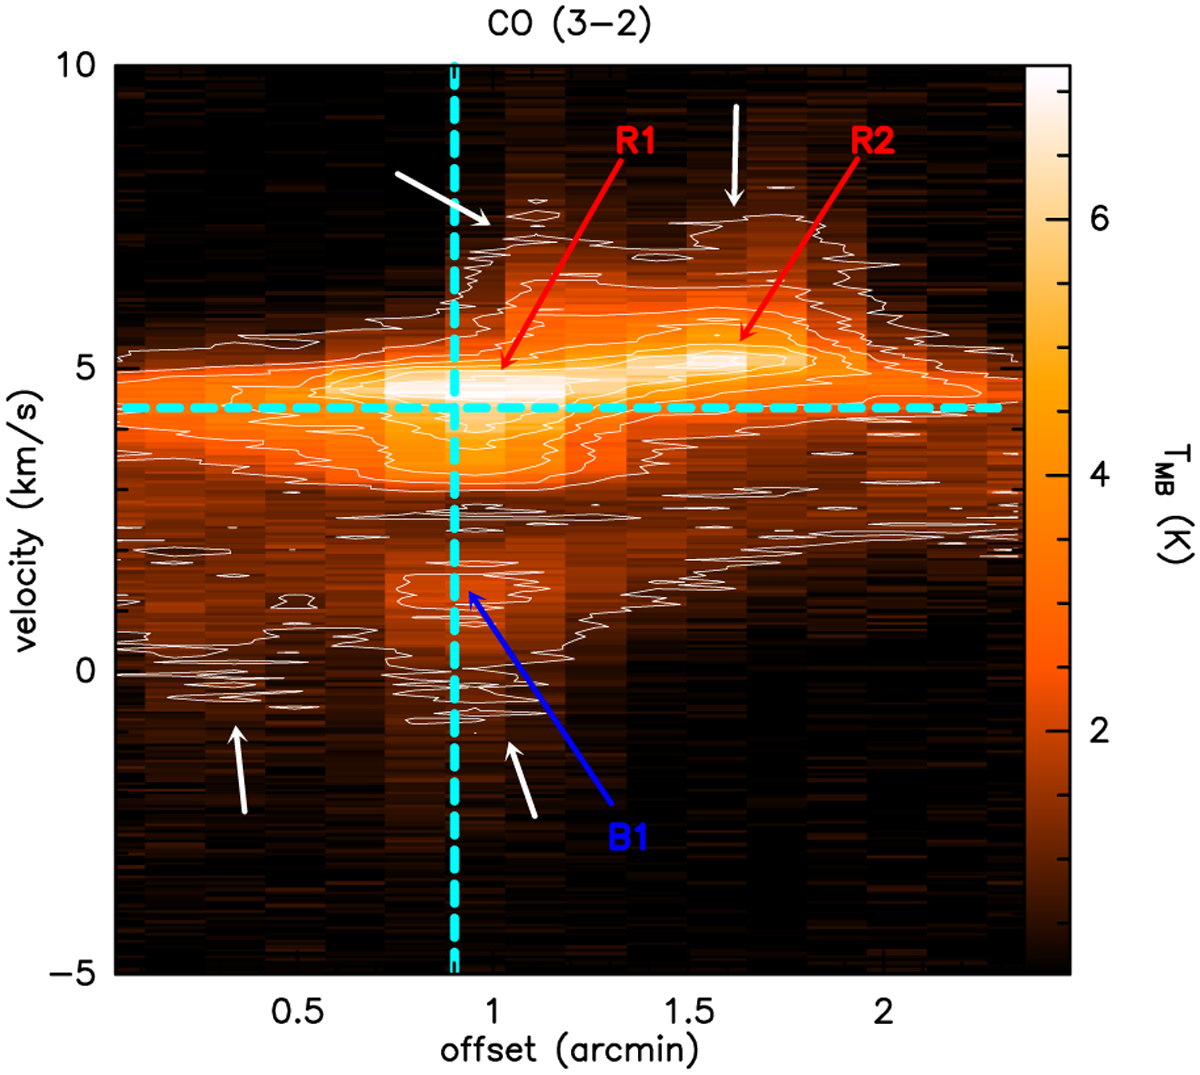
Position-velocity (p-v) diagram along the yellow line shown in Fig. 5. The horizontal dashed cyan line corresponds to the systemic vlsr velocity of 4.35 km s−1 (Szabó et al. 2023a), and the vertical line corresponds to the source position. The contours start at 5σ and end at 35σ with 5σ steps in between. The peaks of the redshifted emission are labeled R1 and R2, and the peak of the blueshifted emission is labeled B1. The white arrows highlight the weak fingers that may trace episodic ejection events.
Current usage metrics show cumulative count of Article Views (full-text article views including HTML views, PDF and ePub downloads, according to the available data) and Abstracts Views on Vision4Press platform.
Data correspond to usage on the plateform after 2015. The current usage metrics is available 48-96 hours after online publication and is updated daily on week days.
Initial download of the metrics may take a while.