Fig. 2
Download original image
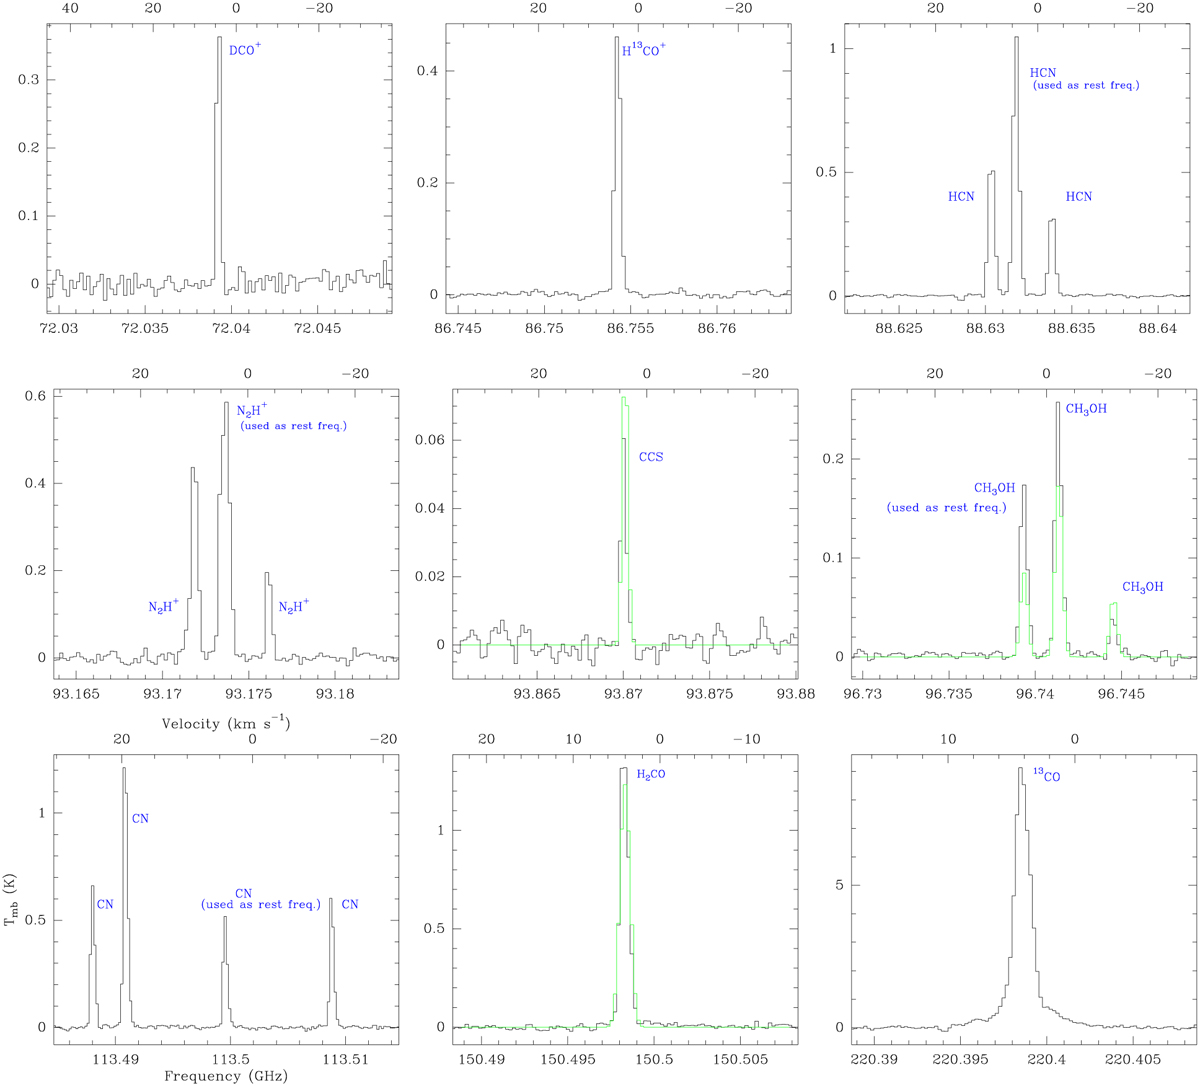
Selection of lines detected with the IRAM 30 m telescope, labeled with the molecular species name in blue; the other lines are shown in Figs. A.1–A.9. LTE synthetic spectra are overlaid in green for selected species (see Sects. 3.4 and 3.5). In each panel, the bottom and top axes are labeled in frequency and velocity, respectively.
Current usage metrics show cumulative count of Article Views (full-text article views including HTML views, PDF and ePub downloads, according to the available data) and Abstracts Views on Vision4Press platform.
Data correspond to usage on the plateform after 2015. The current usage metrics is available 48-96 hours after online publication and is updated daily on week days.
Initial download of the metrics may take a while.