Fig. 1

Download original image
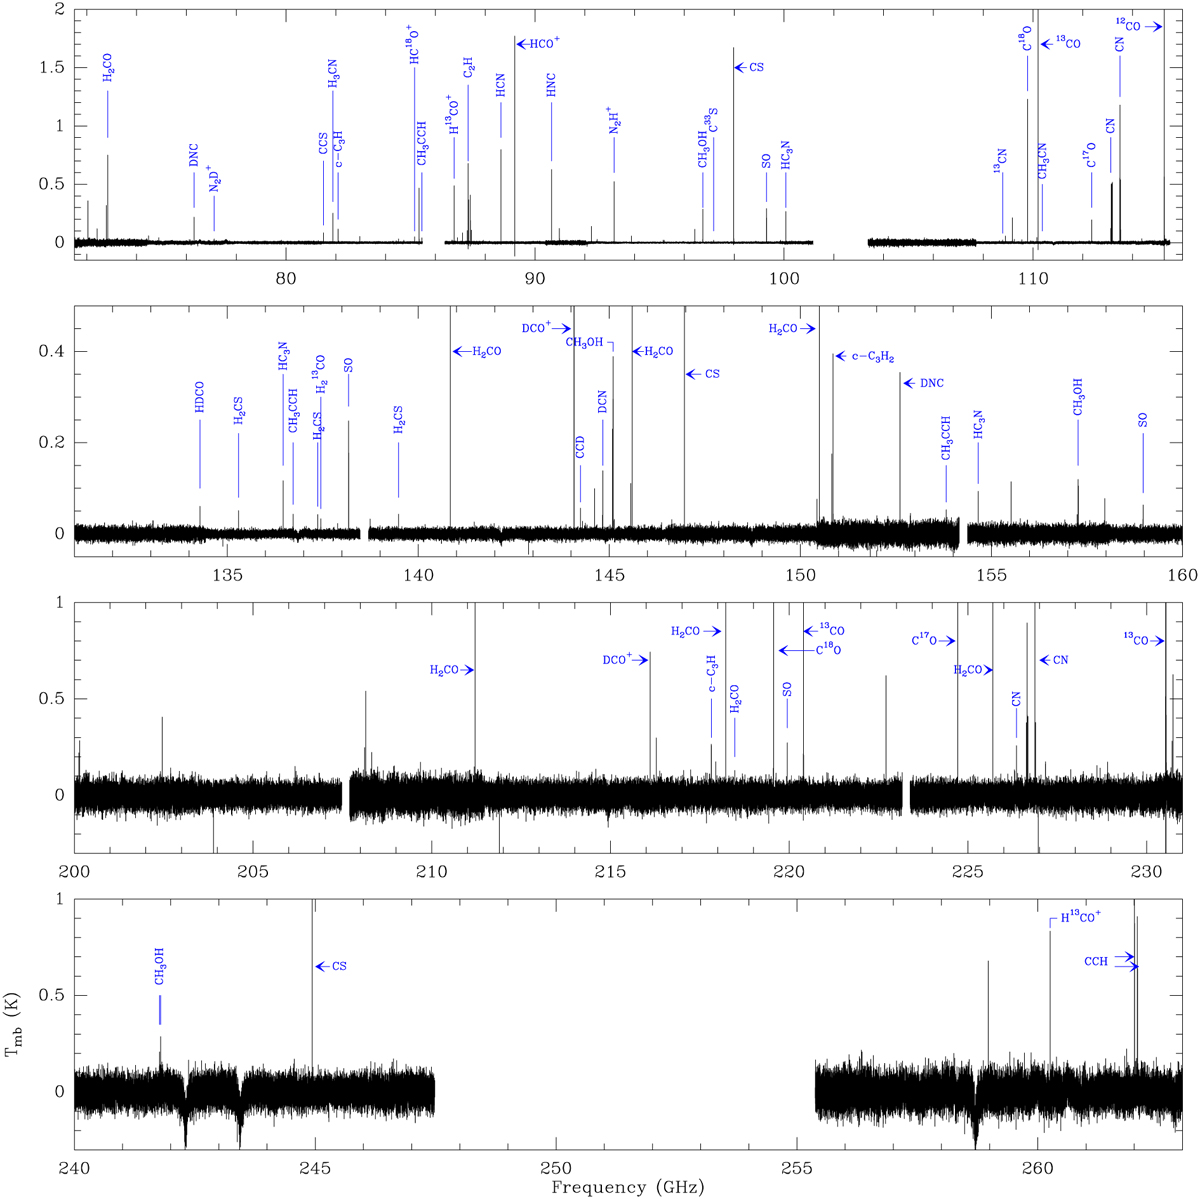
Complete spectrum of V1057 Cyg obtained with the IRAM 30 m telescope. The selected lines are labeled with the name of the molecular species. The complete list of identified lines is provided in Table A.1, and zoom views of all lines are displayed in Fig. 2 and Figs. A.1–A.10 in Appendix A. The deep absorption features around 242–244 GHz and 258–259 GHz represent residual atmospheric absorption.
Current usage metrics show cumulative count of Article Views (full-text article views including HTML views, PDF and ePub downloads, according to the available data) and Abstracts Views on Vision4Press platform.
Data correspond to usage on the plateform after 2015. The current usage metrics is available 48-96 hours after online publication and is updated daily on week days.
Initial download of the metrics may take a while.


